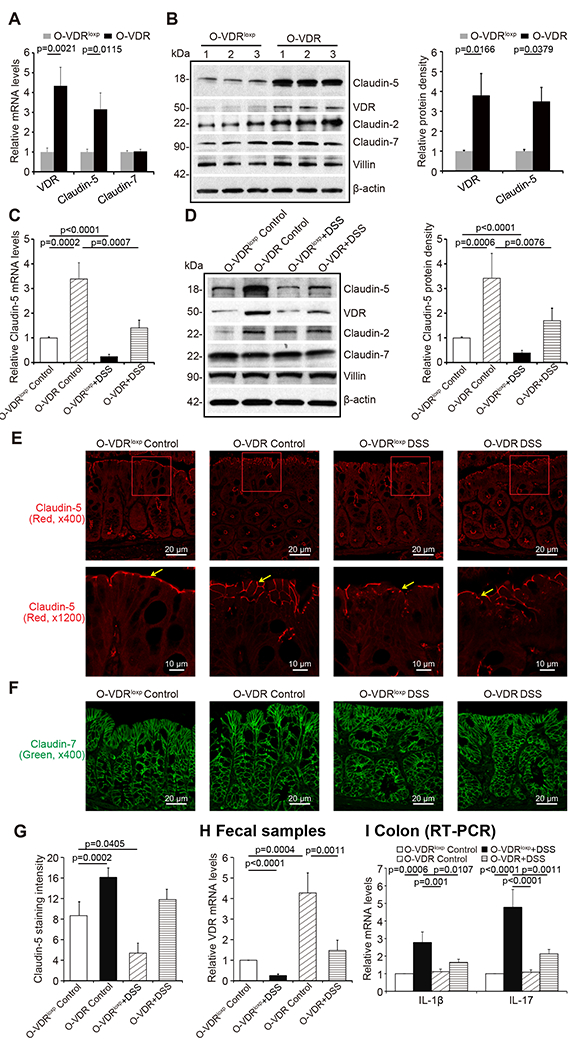
Fig 7. Overexpressed intestinal epithelial VDR led to increased Claudin-5 and reduced inflammation in vivo.

(A) VDR overexpression in mice intestines increased Claudin-5 expression in the colon at mRNA and (B) protein levels (data are expressed as mean ± SD. n = 3, one-way ANOVA test). (C) Claudin-5 was minorly decreased at the mRNA and (D) protein levels in the intestinal tissue of O-VDR mice treatment with DSS compared to levels in the O-VDRloxp mice (data are expressed as mean ± SD. n = 3, one-way ANOVA test). (E) Claudin-5 was minorly decreased in the intestinal tissue of O-VDR mice treated with DSS compared to levels in the O-VDRloxp mice, according to immunofluorescence staining. Images are from a single experiment and represent 5 mice per group. (F) Claudin-7 was unchanged in the intestinal tissue of O-VDR mice treated with DSS compared to levels in the O-VDRloxp mice according to immunofluorescence staining. Images are from a single experiment and represent 5 mice per group. (G) Intensity of the staining of Claudin-5. Images are from a single experiment and represent 5 mice per group. (Data are expressed as mean ± SD. n = 5, one-way ANOVA test). (H) VDR level in fecal samples was detected by RT-PCR. VDR expression was slightly decreased in O-VDR mice treated with DSS compared to O-VDRloxp mice treated with DSS (data are expressed as mean ± SD. n = 3, one-way ANOVA test). (I) The inflammatory cytokines IL-1β and IL-17 were less increased in the DSS-induced O-VDR mice colitis model compared to the levels in O-VDRloxp mice (data are expressed as mean ± SD. n = 3, one-way ANOVA test). All p values are shown in the figure.
