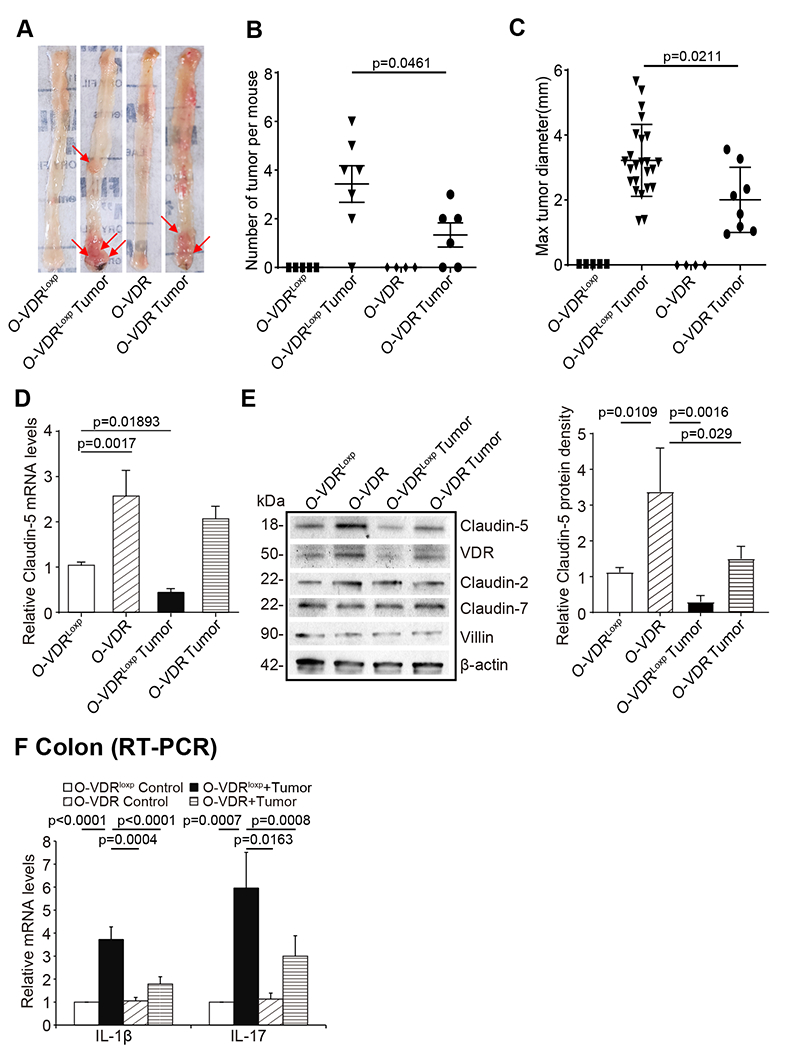
Fig 8. Intestinal epithelial VDR overexpression mice have fewer and smaller tumors and show protection from decreased Claudin-5 and increased inflammation.

(A) Colonic tumors in situ. Representative colons from different groups. Tumors were indicated by red arrows. (B) Tumor numbers in AOM-DSS induced colon cancer model: O-VDRloxp and O-VDR mice (data are expressed as mean ± SD. n = 4-7, one-way ANOVA test,). (C) Max tumor size in AOM-DSS induced colon cancer model: O-VDRloxp and O-VDR mice (data are expressed as mean ± SD. n = 4-7, one-way ANOVA test). (D) Claudin-5 at the mRNA and (E) protein levels were decreased in the tumor tissue than in the control mice. O-VDRloxp mice tumor tissue had much more decrease than the O-VDR mice (data are expressed as mean ± SD. n = 3, one-way ANOVA test). (F) The inflammatory cytokines IL-1β and IL-17 were less increased in the AOM/DSS-induced O-VDR mice colon cancer model, than the levels in O-VDRloxp mice (data are expressed as mean ± SD. n = 3, one-way ANOVA test). All p values are shown in the figure.
