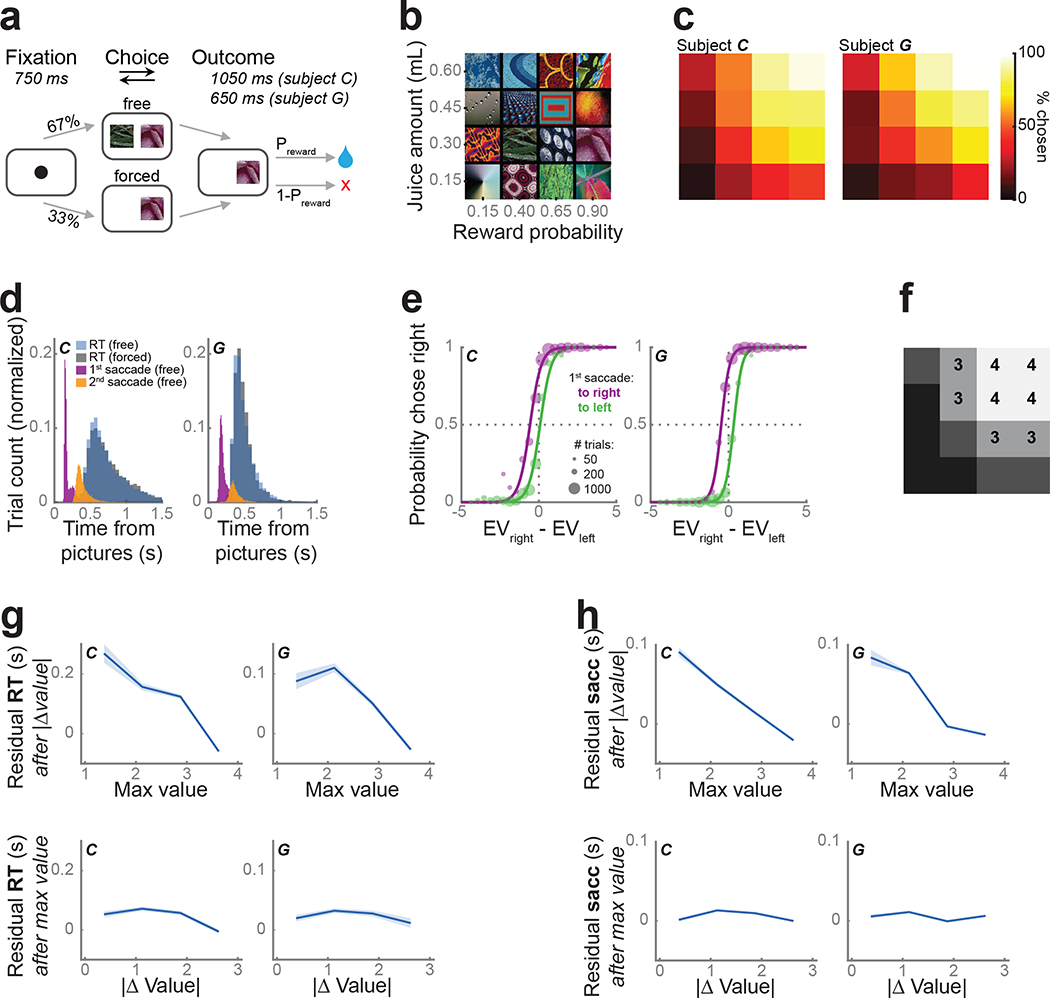
Figure 1.
Task and behavior.
(a) Subjects fixated a cue to initiate each trial. They were presented with one (forced choice trials) or two (free) pictures. After indicating their choice with a lever, they received the corresponding juice amount with the probability Preward.
(b) Subjects learned 16 pictures associated with different juice amounts and reward probabilities.
(c) Subjects were more likely to choose pictures associated with larger and more probable rewards. Using the same arrangement as (b), the color indicates the percent of free trials on which each picture was chosen.
(d) Lever response time distributions for free (blue) and forced (gray) trials. First (purple) and second (orange) saccade distributions from free trials.
(e) The likelihood of choosing the right picture as a function of the difference in expected value (EV) of the two pictures, separated by the first saccade direction. Circle size represents the number of trials. Lines show the model fit. Both subjects were more likely to select an option when they first looked at it.
(f) We split the pictures into equal-sized groups from lowest expected value (value bin = 1) to highest (value bin = 4). Groupings were the same for both subjects. Same arrangement as (b).
(g) The unique effects of maximum value and value difference on reaction times. To visualize the unique contributions of each of these predictors, log10(response times) were modeled as a linear function of one parameter and the residuals (mean ± s.e.m.) were plotted as a function of the other parameter.
(h) The effect of maximum value and value difference on the timing of the first saccade. Conventions as in (g).

