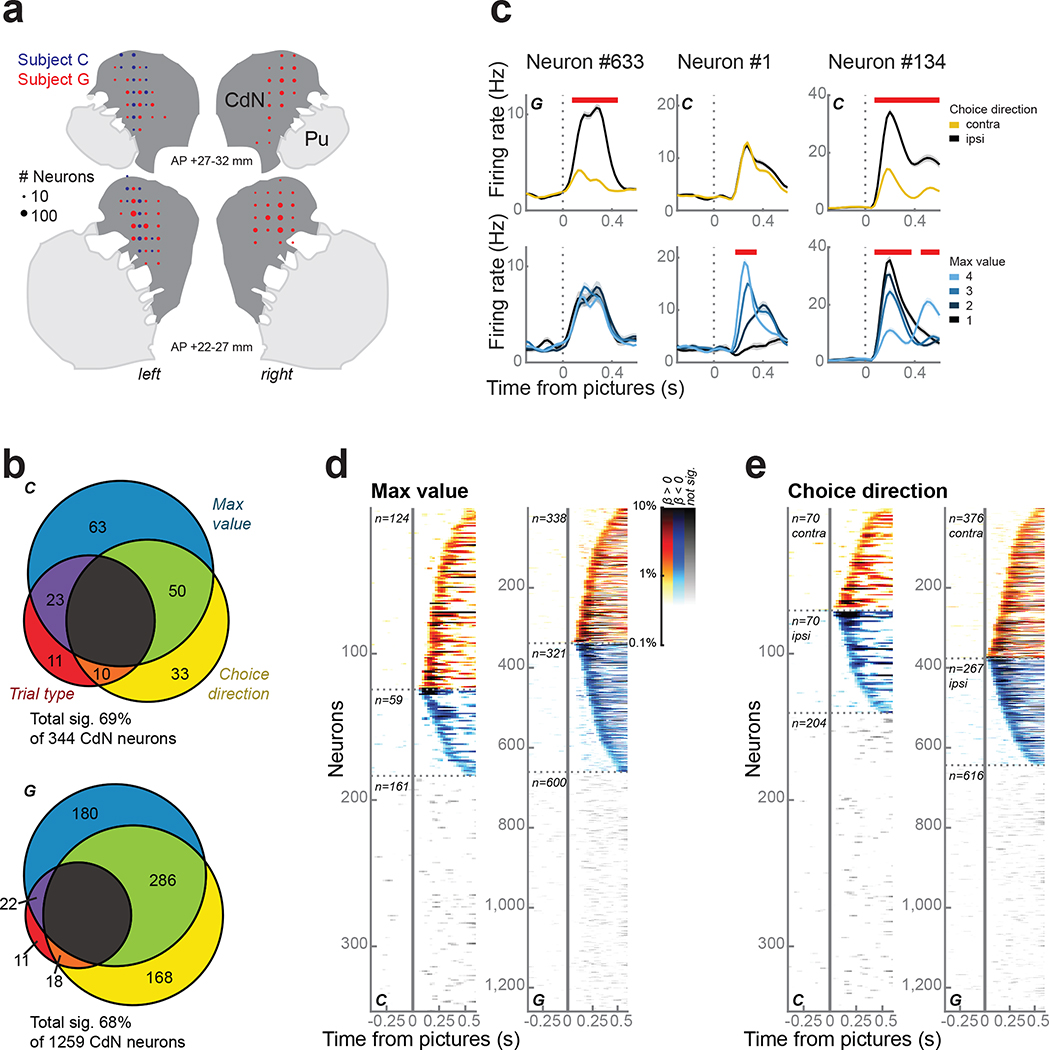
Figure 2.
CdN neurons.
(a) Reconstruction of CdN recording sites on coronal slices. Circles represent the number of neurons.
(b) CdN neuron firing rates were modelled as a linear combination of maximum value, choice direction, and trial type. Most neurons were significantly predicted by at least one factor during the first 500 ms following picture onset.
(c) Three example neurons illustrating prevalent response types, including significant encoding of choice direction (left column), maximum value (middle), or both (right). Panels within each column show firing rates (mean ± s.e.m.) averaged over choice direction (top row) or maximum value (bottom row). Red bars at the top of each panel indicate periods of significance as determined from the regression.
(d) Single neuron encoding of maximum value across the entire population. Each horizontal line indicates data from a single neuron. Color intensity indicates the percentage of variance in the neuron’s firing rate explained by maximum value as determined by the coefficient of partial determination. Neurons were grouped according to whether they showed a positive (hot colors) or negative (cold colors) relationship between firing rate and value and ordered by the first significant time bin. Data from non-significant neurons are shown using grayscale.
(e) Single neuron encoding of choice direction across the entire population. Conventions as in (d).

