Figure 3.
Direction decoding from CdN population.
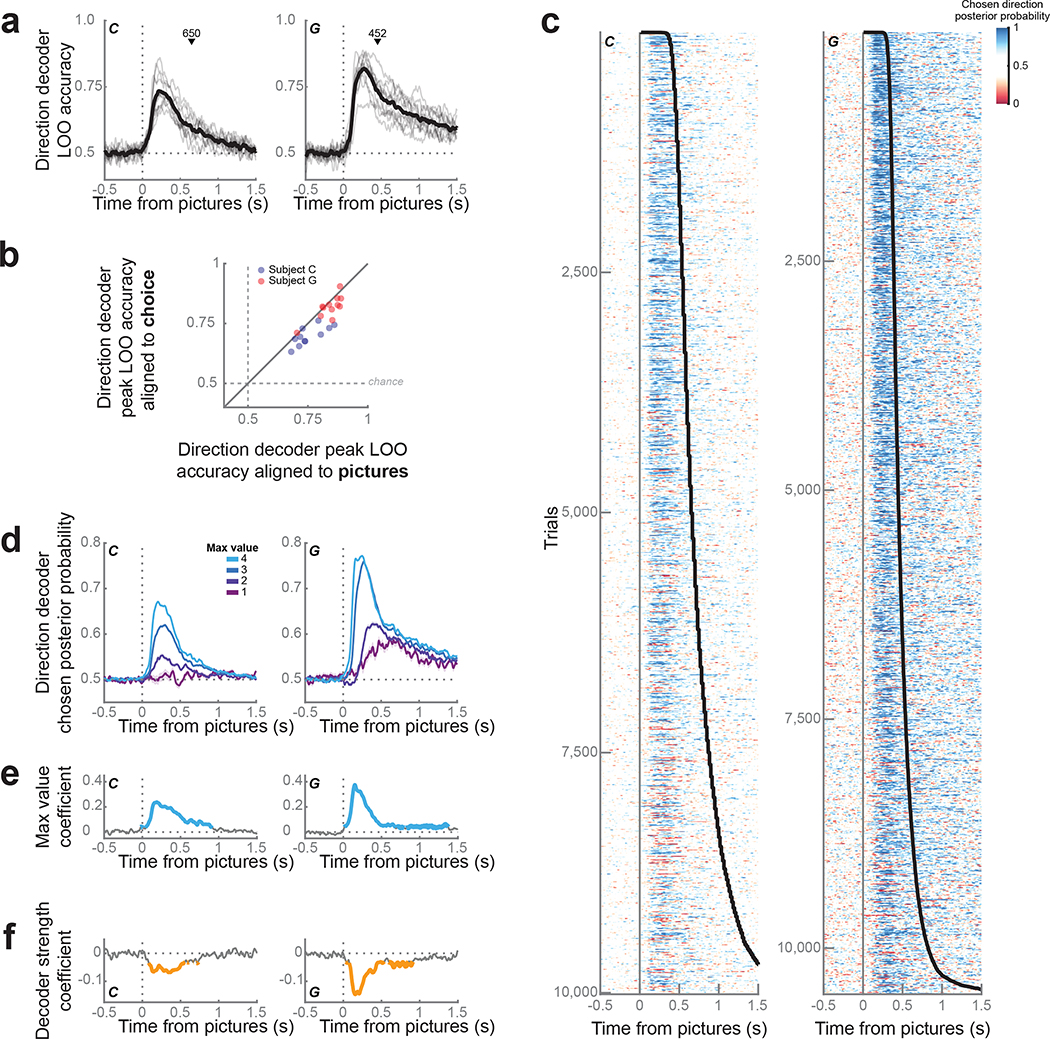
(a) Population decoding of choice direction (left or right) on free trials from CdN. Gray lines represent accuracy from the leave-one-out validation procedure for each session; the mean across sessions is shown in black. The mean choice time (black triangle) is shown for reference.
(b) Peak LOO accuracy of the direction decoder for each session, trained on trials aligned to the onset of the pictures (x-axis) compared to choice (y-axis). Most sessions for both subjects fall below the diagonal equality line, indicating better decoding performance for trials aligned to picture onset (C: 68 ± 1%, paired t(10) = 4.7, p < 0.001; G: 80 ± 1%, paired t(11) = 2.5, p = 0.02).
(c) We used the LDA weights to compute the posterior probability for the choice direction on held-out free trials (1 = chosen direction, 0 = unchosen direction). Each row corresponds to a single trial, ordered by increasing response time (black line).
(d) Choice direction representation strength increased with maximum picture value. Lines represent mean ± s.e.m. choice direction posterior probability across trials grouped by maximum value.
(e) We performed a linear regression to verify the observation in (d) by modelling choice direction strength as a function of maximum value. Blue lines indicate significant periods, p < 0.001.
(f) Regression of response times as a function of choice direction strength after partialing out the effect of maximum value. Orange lines indicate significant periods, p < 0.001.

