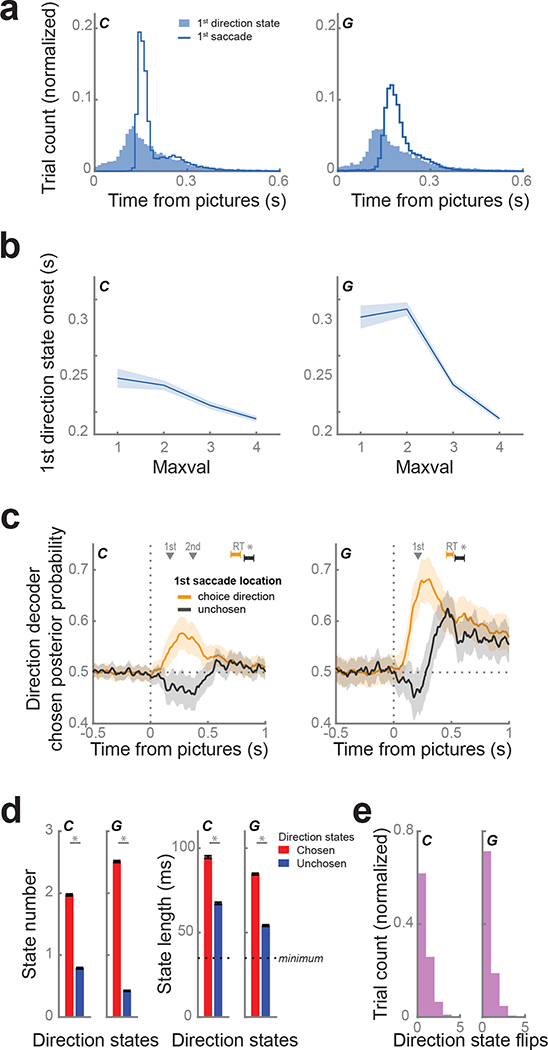
Figure 4.
CdN population tracks first saccade.
(a) We defined direction states as sustained periods of decoding of choice direction. The distribution of first state onsets (shaded blue) coincided with the distribution of first saccade movements (blue line).
(b) First direction state onsets occurred significantly earlier on trials with higher maximum picture values.
(c) We compared the average choice direction posterior probability for trials where the first saccade location was to the choice direction (matched trials; orange) and the unchosen direction (mismatched trials; black), restricting our analysis to trials where the pictures were of equal value. Dark lines represent the means calculated from 10,000 bootstrapped samples. Subjects responded more quickly (subject C: 116 ms, G: 83 ms) on matched trials. Shading and error bars indicate 99.9% CIs. Gray triangles indicate the mean time of the 1st (both subjects) and 2nd saccade (subject C only) across both trial groups.
(d) During the 800 ms immediately following picture onset, chosen states (red) were more prevalent (right) and longer duration (left) than unchosen (blue) direction states. Asterisks indicate p < 1 ×10⁻¹⁵ determined from paired t-tests.
(e) Distribution of number of flips between chosen and unchosen direction states per trial.

