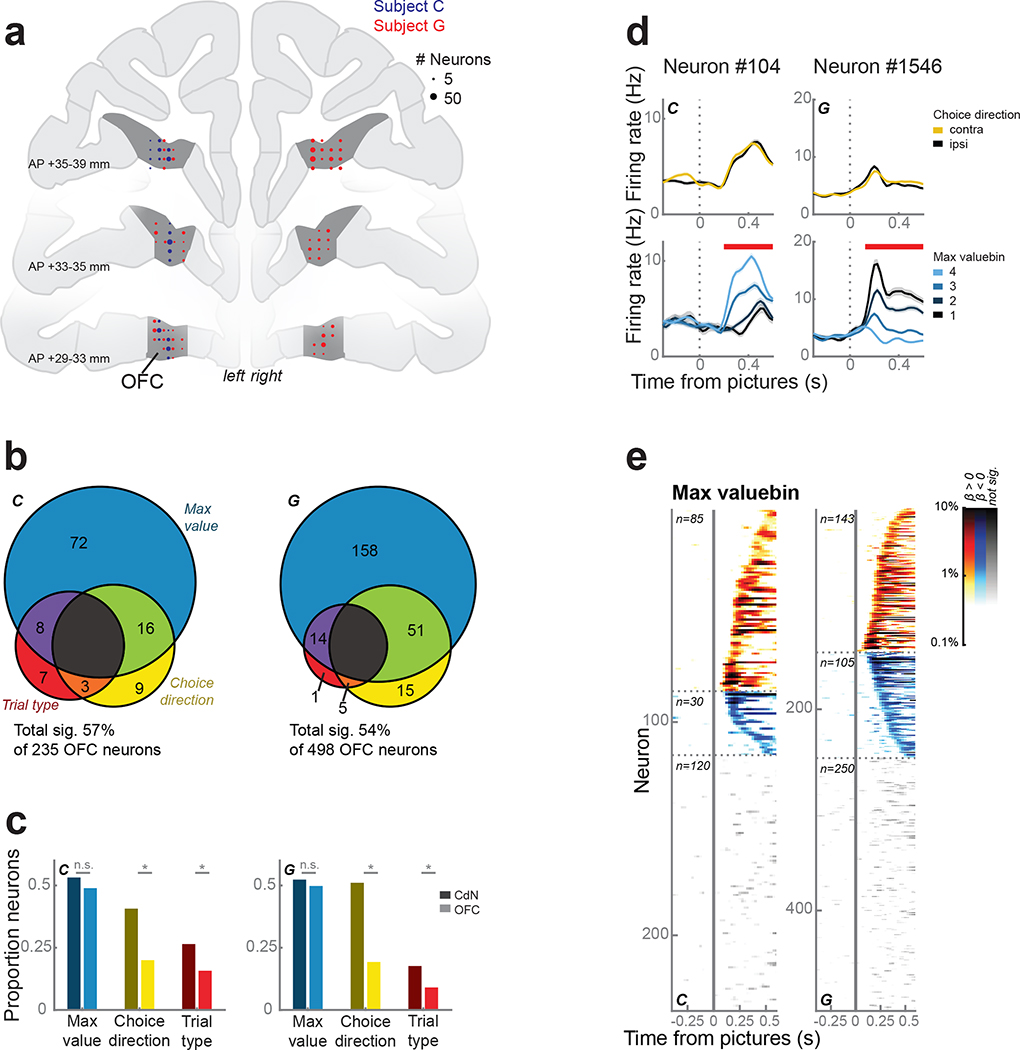
Figure 5.
OFC neurons.
(a) Reconstruction of OFC recording sites on coronal slices. Circles represent the number of neurons.
(b) OFC neuron firing rates were modelled as a linear combination of maximum value, choice direction, and trial type. About half of the neurons were significantly predicted by at least one factor during the first 500 ms after picture onset, of which the majority was dominated by maximum value.
(c) Proportion of neurons in CdN (dark colors) and OFC (light colors) significantly predicted by each factor (from Figs. 2b and 5b). Asterisks indicate p < 0.01 as determined by a χ2 test. There was no difference between the areas in the prevalence of value-encoding neurons, but neurons encoding choice direction and trial type were more common in CdN.
(d) Two example OFC neurons that were modulated by maximum value, but not choice direction. Conventions as in Fig. 2c.
(e) Single neuron encoding of maximum value across the entire OFC population. Conventions as in Fig. 2d.

