Figure 6.
Value dynamics in OFC.
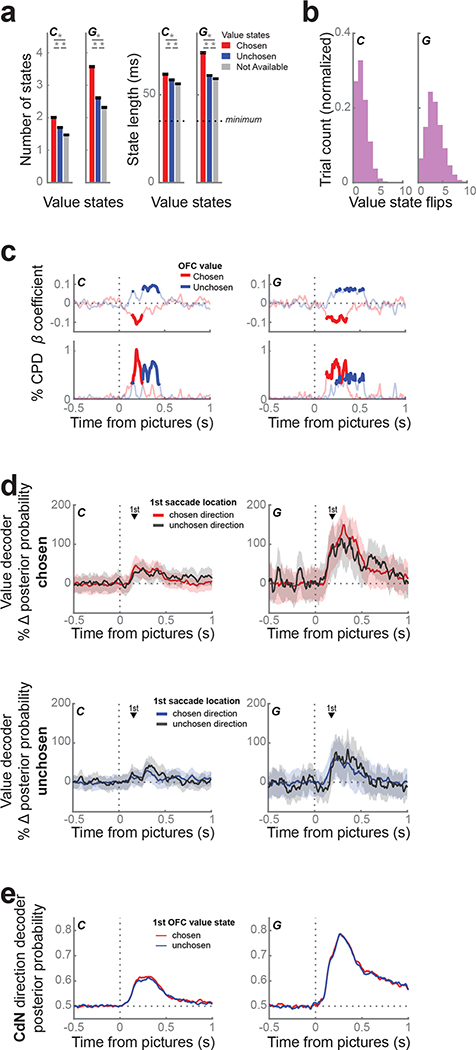
(a) We trained an LDA decoder to classify picture value (1 – 4) on forced trials from OFC and applied the decoder weights to free trials in sliding windows. Value states are sustained periods of confident decoding of value. The prevalence (left) and duration (right) of value states favored chosen (red) over unchosen (blue) over unavailable (gray) value states. Asterisks indicate p < 0.001 as determined from a 1-way ANOVA with post-hoc t-tests.
(b) Distribution of number of flips between chosen and unchosen value states per trial.
(c) Response times were faster when the chosen value (red) was decoded more strongly, and slower when the unchosen value (blue) was decoded more strongly. We built a linear regression for response time with chosen and unchosen decoding strength as predictors. Top: regression coefficients; bottom: % CPD. Bold lines indicate p < 0.001.
(d) We compared the average decoding strength of the chosen value (top) or the unchosen value (bottom) for trials where the first saccade location was to the chosen direction (shaded) and the unchosen direction (black line), using the same procedure as in Figure 4c. There was no difference in decoding strength of either value given the first saccade direction. Shading indicates bootstrapped 99.9% confidence intervals. The mean 1st saccade times (black triangles) are shown for reference.
(e) We observed no difference in the strength (mean ± s.e.m.) of the CdN direction decoder between trials with an initial chosen (red) or unchosen (blue) value state in OFC.

