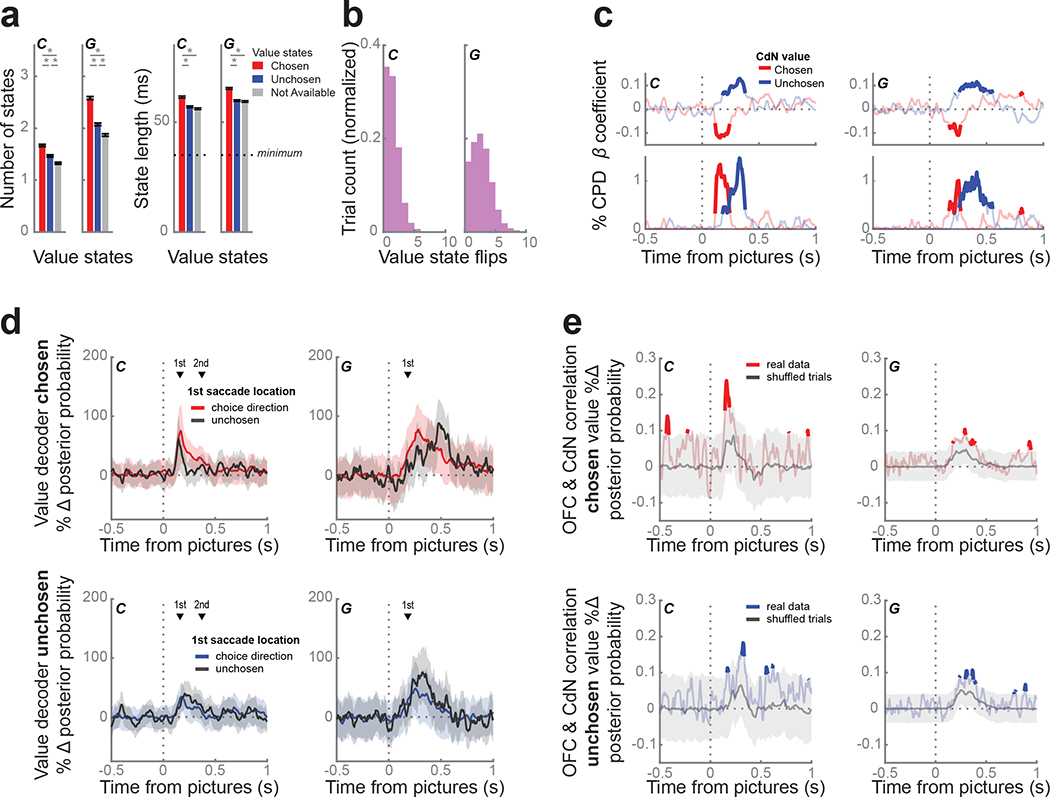
Figure 7.
Value dynamics in CdN.
(a) We trained an LDA decoder to classify picture value from CdN using the same procedure as in Figure 6a. The prevalence (left) and duration (right) of value states favored chosen (red) over unchosen (blue) and unavailable (gray) value states. Asterisks indicate p < 0.001 as determined from a 1-way ANOVA with post-hoc tests.
(b) Distribution of number of flips between chosen and unchosen value states per trial.
(c) Response times were faster when the chosen value (red) was decoded more strongly, and slower when the unchosen value (blue) was decoded more strongly, using the same regression and visualization as Figure 6c.
(d) We compared the average value decoding strength of the chosen (top) or the unchosen value (bottom) for trials where the first saccade location was to the chosen (shaded) or the unchosen direction (black line), using the same procedure as Figures 4c and 6d. Decoding strength of either value did not depend on the direction of the first saccade. Shading indicates bootstrapped 99.9% confidence intervals. The mean 1st saccade times (black triangles) are shown for reference.
(e) We correlated the chosen (top, red) and unchosen (bottom, blue) value strength decoded from OFC and CdN on individual trials at each time point. We built a null distribution of correlation values from 10,000 permutations of trials; the gray line represents the median across these permutations and the shaded area indicates the 1% and 99% bounds. There was a weak, but significant, correlation in both animals during the first 500 ms of the choice period indicating that OFC and CdN tended to encode the same value at the same time.

