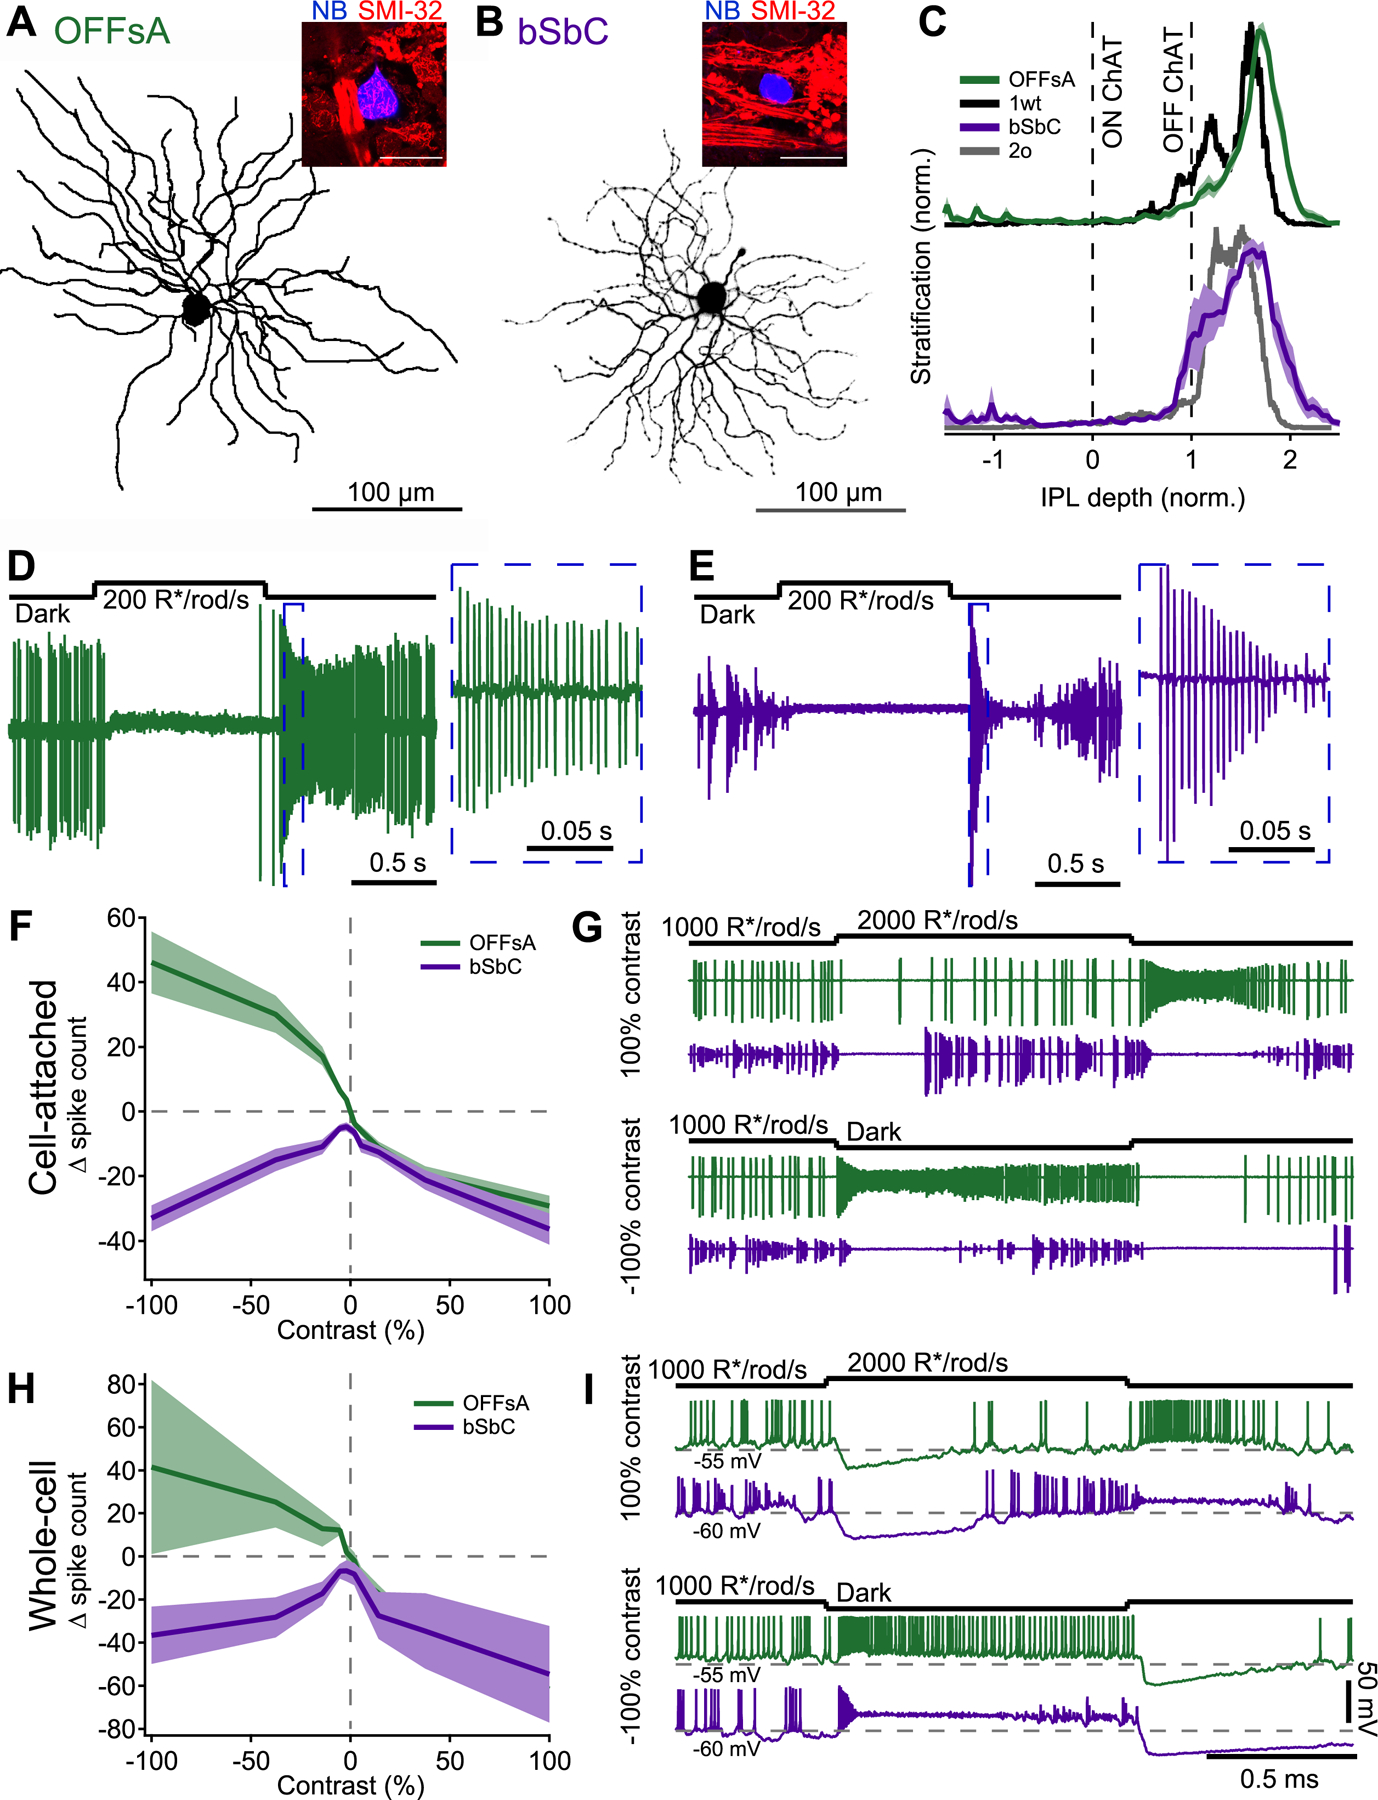
Figure 1. The OFFsA and bSbC are distinct RGC types with different contrast response functions.

(A, B) En face view of an OFFsA (A) and a bSbC (B) dendritic arbor imaged using 2-photon. Insets show a Neurobiotin labeled soma of each RGC type (blue) and SMI-32 immunoreactivity (red).
(C) Dendritic stratification for the OFFsA (green) as compared to the Eyewire type 1wt (black) and the bSbC (purple) as compared to the Eyewire type 2o (gray). Dotted lines refer to the ON and OFF ChAT (choline acetyltransferase) bands used to determine the stratification (see Methods).
(D, E) Light step responses for an OFFsA (D) and a bSbC (E) measured in loose patch configuration. Insets show a magnified view of the OFF response.
(F) Contrast response functions in cell-attached recordings of OFFsA (green) and bSbC (purple) RGCs. Spikes were counted over the entire stimulus interval then were baseline subtracted. Error bars are SEM across cells (N = 37 OFFsA, 15 bSbC).
(G) Representative cell-attached traces of OFFsA (green) and bSbC (purple) RGCs responding to a +100% (top) and a −100% (bottom) contrast step.
(H) Same as (F) but for whole-cell current clamp recordings. (N = 3 OFFsA, 4 bSbC)
(I) Same as (G) but for whole-cell current clamp recordings.
