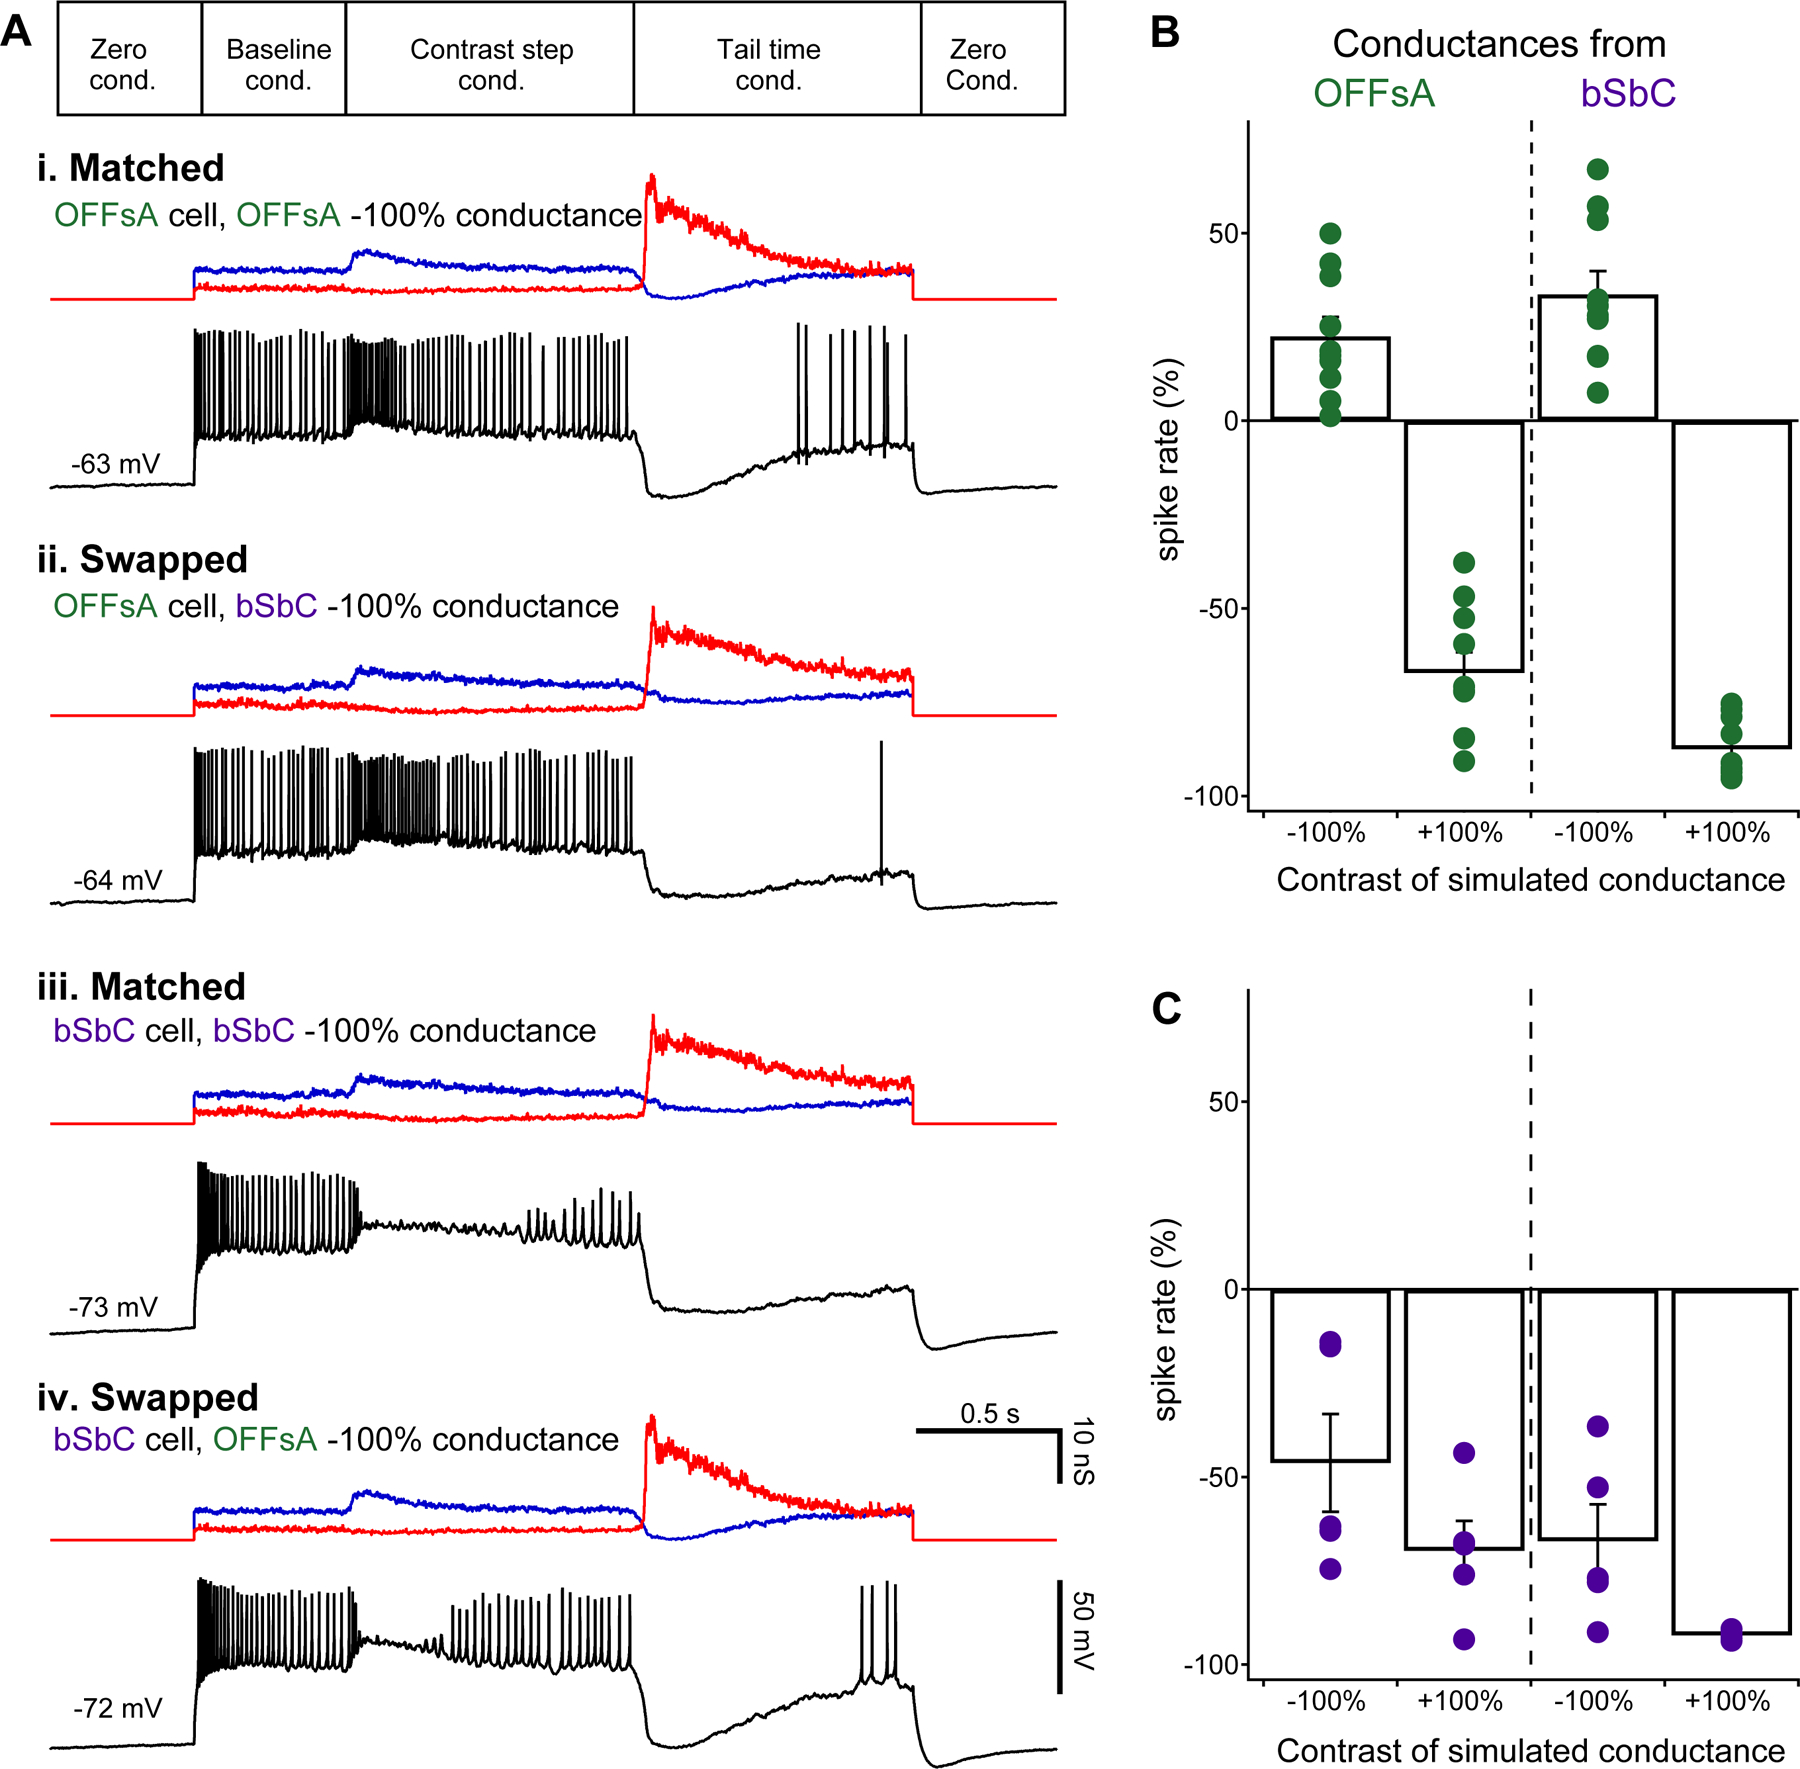
Figure 2. Synaptic conductances in OFFsA and bSbC are functionally interchangeable.

(A) Dynamic clamp protocol (top) and example current traces (black) from 4 conditions as indicated. Excitatory (blue) and inhibitory (red) input conductances are shown above each trace.
(B) Change in spike rate during the first 0.5 s after simulated stimulus onset measured in OFFsA RGCs for simulated OFFsA conductances (left) and bSbC conductances (right) for both negative and positive contrast conditions.
(C) Same as (B) for bSbC RGCs. OFFsA N = 10, bSbC N = 5.
See also Figures S2 and S3.
