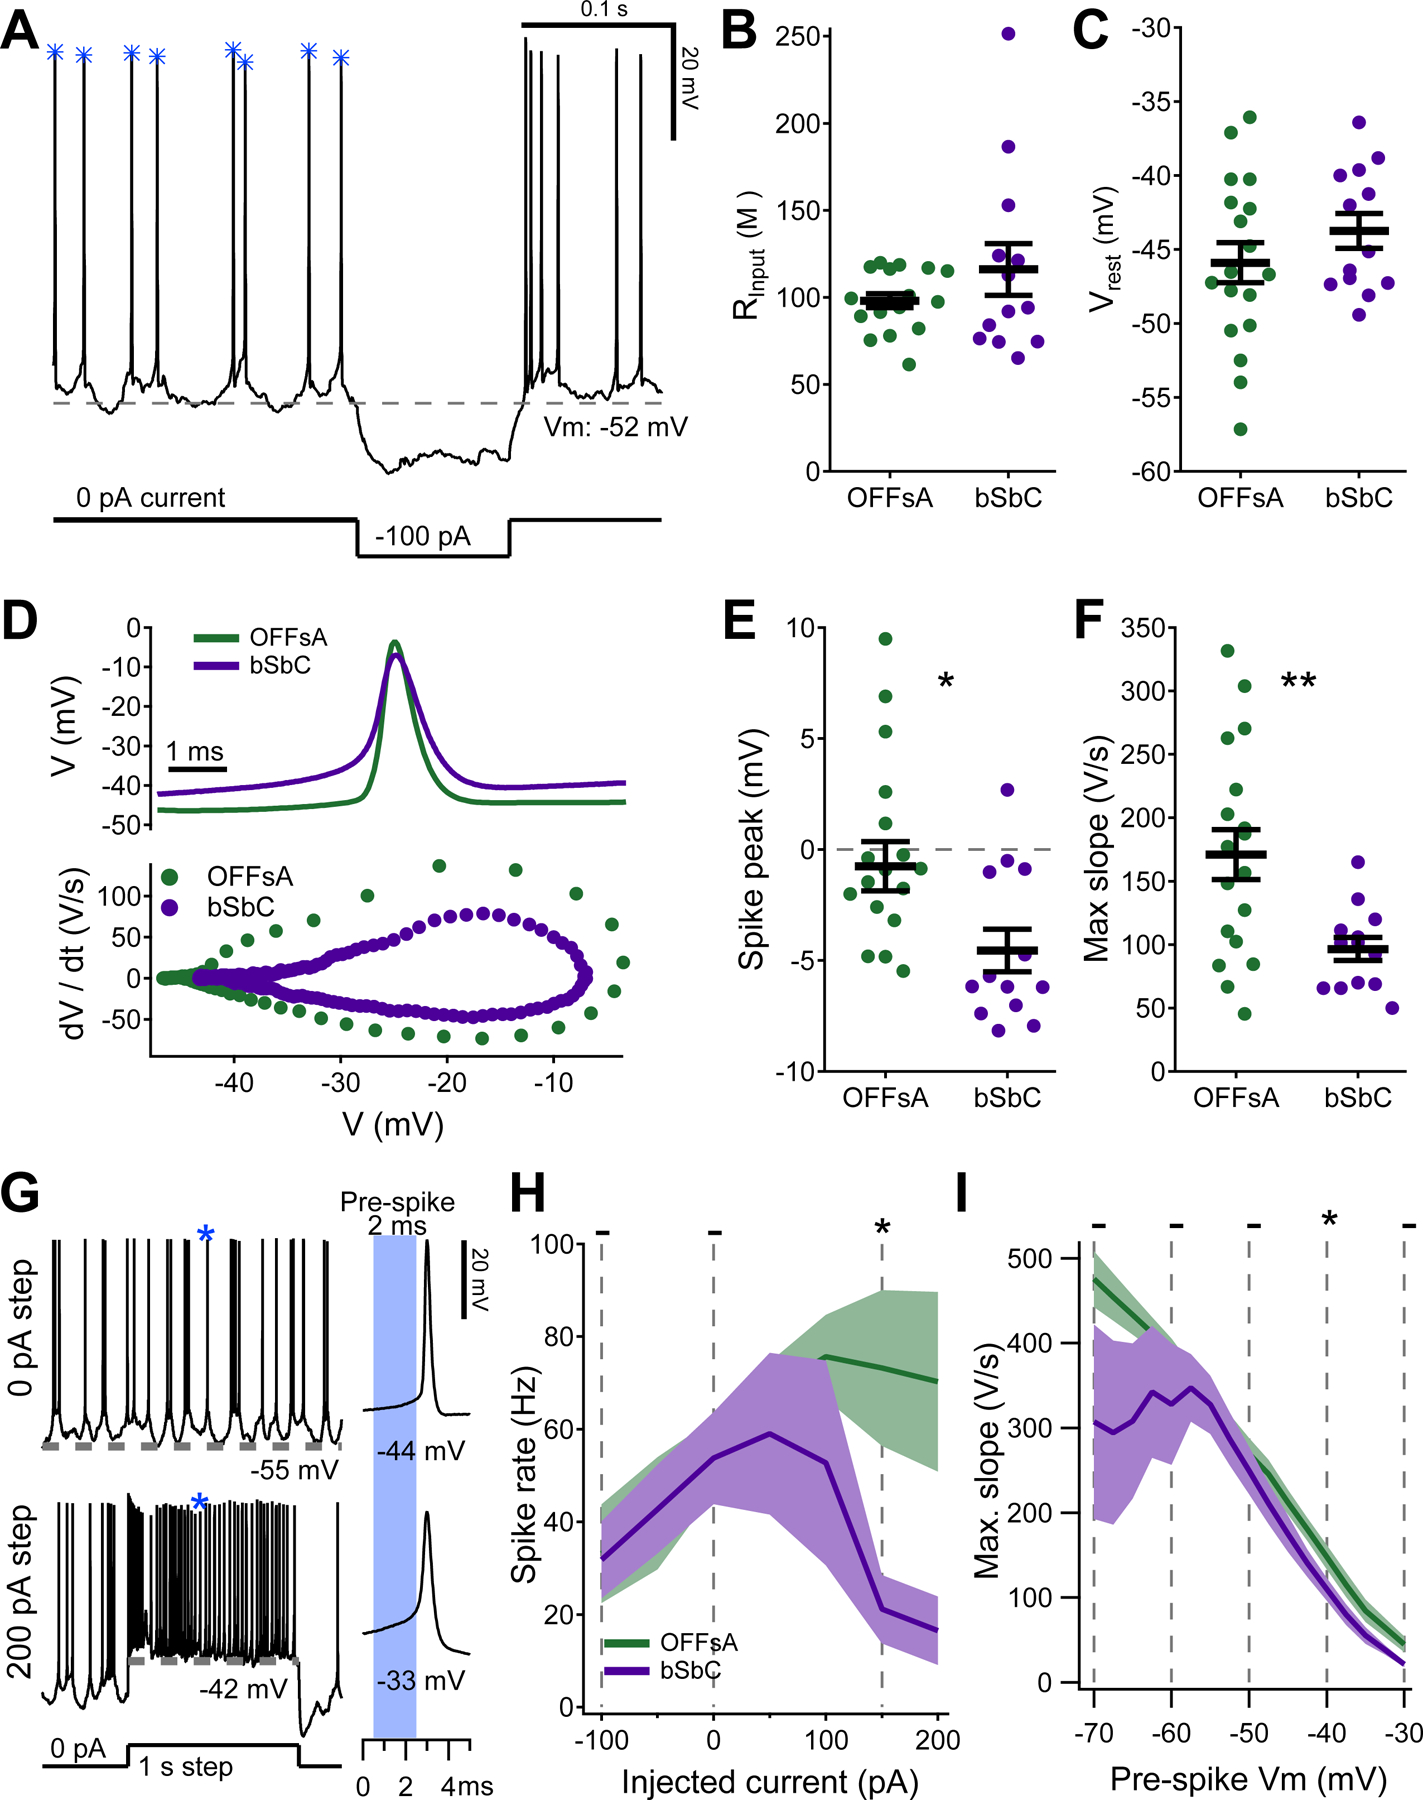
Figure 3. Spike waveforms of the OFFsA and bSbC reveal differences in active conductances.

(A) Raw data trace from a cell recorded at rest, in darkness with spontaneous spikes. A hyperpolarizing step was used to calculate input resistance (B). Gray dotted line denotes the resting membrane potential (C). The blue asterisks show which spikes were included for analysis in (D-E).
(B, C) Passive electrical properties of OFFsA and bSbC RGCs: input resistance (OFFsA N = 18, bSbC N=14, p = 0.24) (B) and resting membrane potential (p = 0.26) (C).
(D) Representative average spike waveforms for OFFsA (green) and bSbC (purple) RGCs (top) and their accompanying dV/dt plots (bottom).
(E, F) Parameters of spontaneous spike waveforms in OFFsA and bSbC RGCs: spike peak (p = 0.014) (E) and maximum rising slope (p = 0.0022) (F). ** p < 0.01; * p < 0.05.
(G) Example traces from a cell at rest with 0 pA of baseline current with current steps of 0 pA (top) and 200 pA (bottom). A spike of interest is indicated with a blue asterisk and is shown expanded at right. The pre-spike Vm was calculated using the 2 ms prior to threshold (blue shaded region).
(H) Firing rate as a function of injected current. Shaded region is SEM across cells (OFFsA N = 9, bSbC N = 6). Statistics are calculated using the non-parametric permutation test (Methods); * p < 0.05, - not significant.
(I) Maximum rising slope as a function of the voltage immediately preceding each spike. Shaded region is SEM across cells (OFFsA N = 10, bSbC N = 6). * p < 0.05, - not significant.
