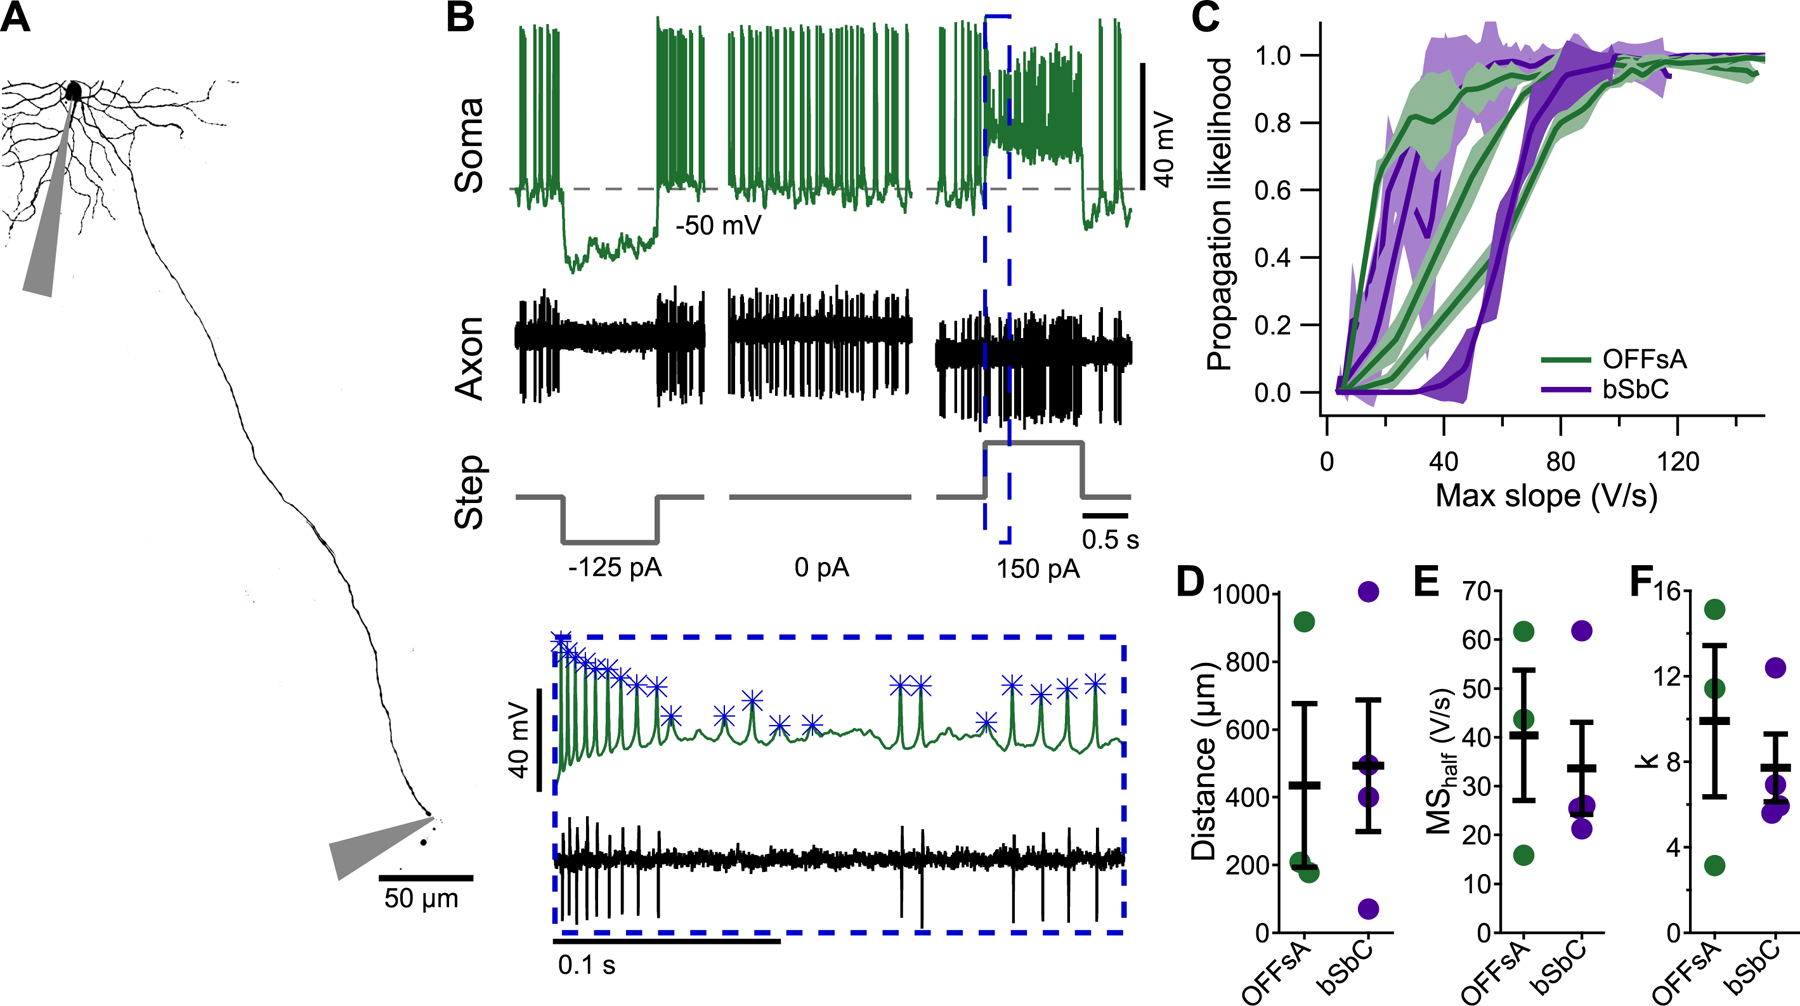
Figure 4. Spike propagation depends on spike waveforms similarly in OFFsA and bSbC RGCs.

(A) A Z-projected image of an OFFsA RGC filled with Alexa 488 showing the positions of the somatic and axonal electrodes.
(B) Traces from the soma (top) and axon (bottom) electrodes for the cell in (A) along with injected current steps (bottom). Inset shows magnified view with analyzed somatic spike events marked with asterisks.
(C) Spike propagation likelihood as a function of the maximum slope of the somatic spike in OFFsA (green, N = 3) and bSbC (purple, N = 4) RGCs. Shaded regions are 2 standard deviations from the mean over randomly subsampled groups (see Methods).
(D) Distance from the soma at which the axon recordings were performed for each cell type (p = 0.86).
(E,F) Parameters for each trace in (C) for the fit of the equation likelihood = 1/(1+exp(-x -MShalf)/k)) (see Methods) for each cell type for the MShalf (E, p = 0.69) and k (F, p = 0.56).
