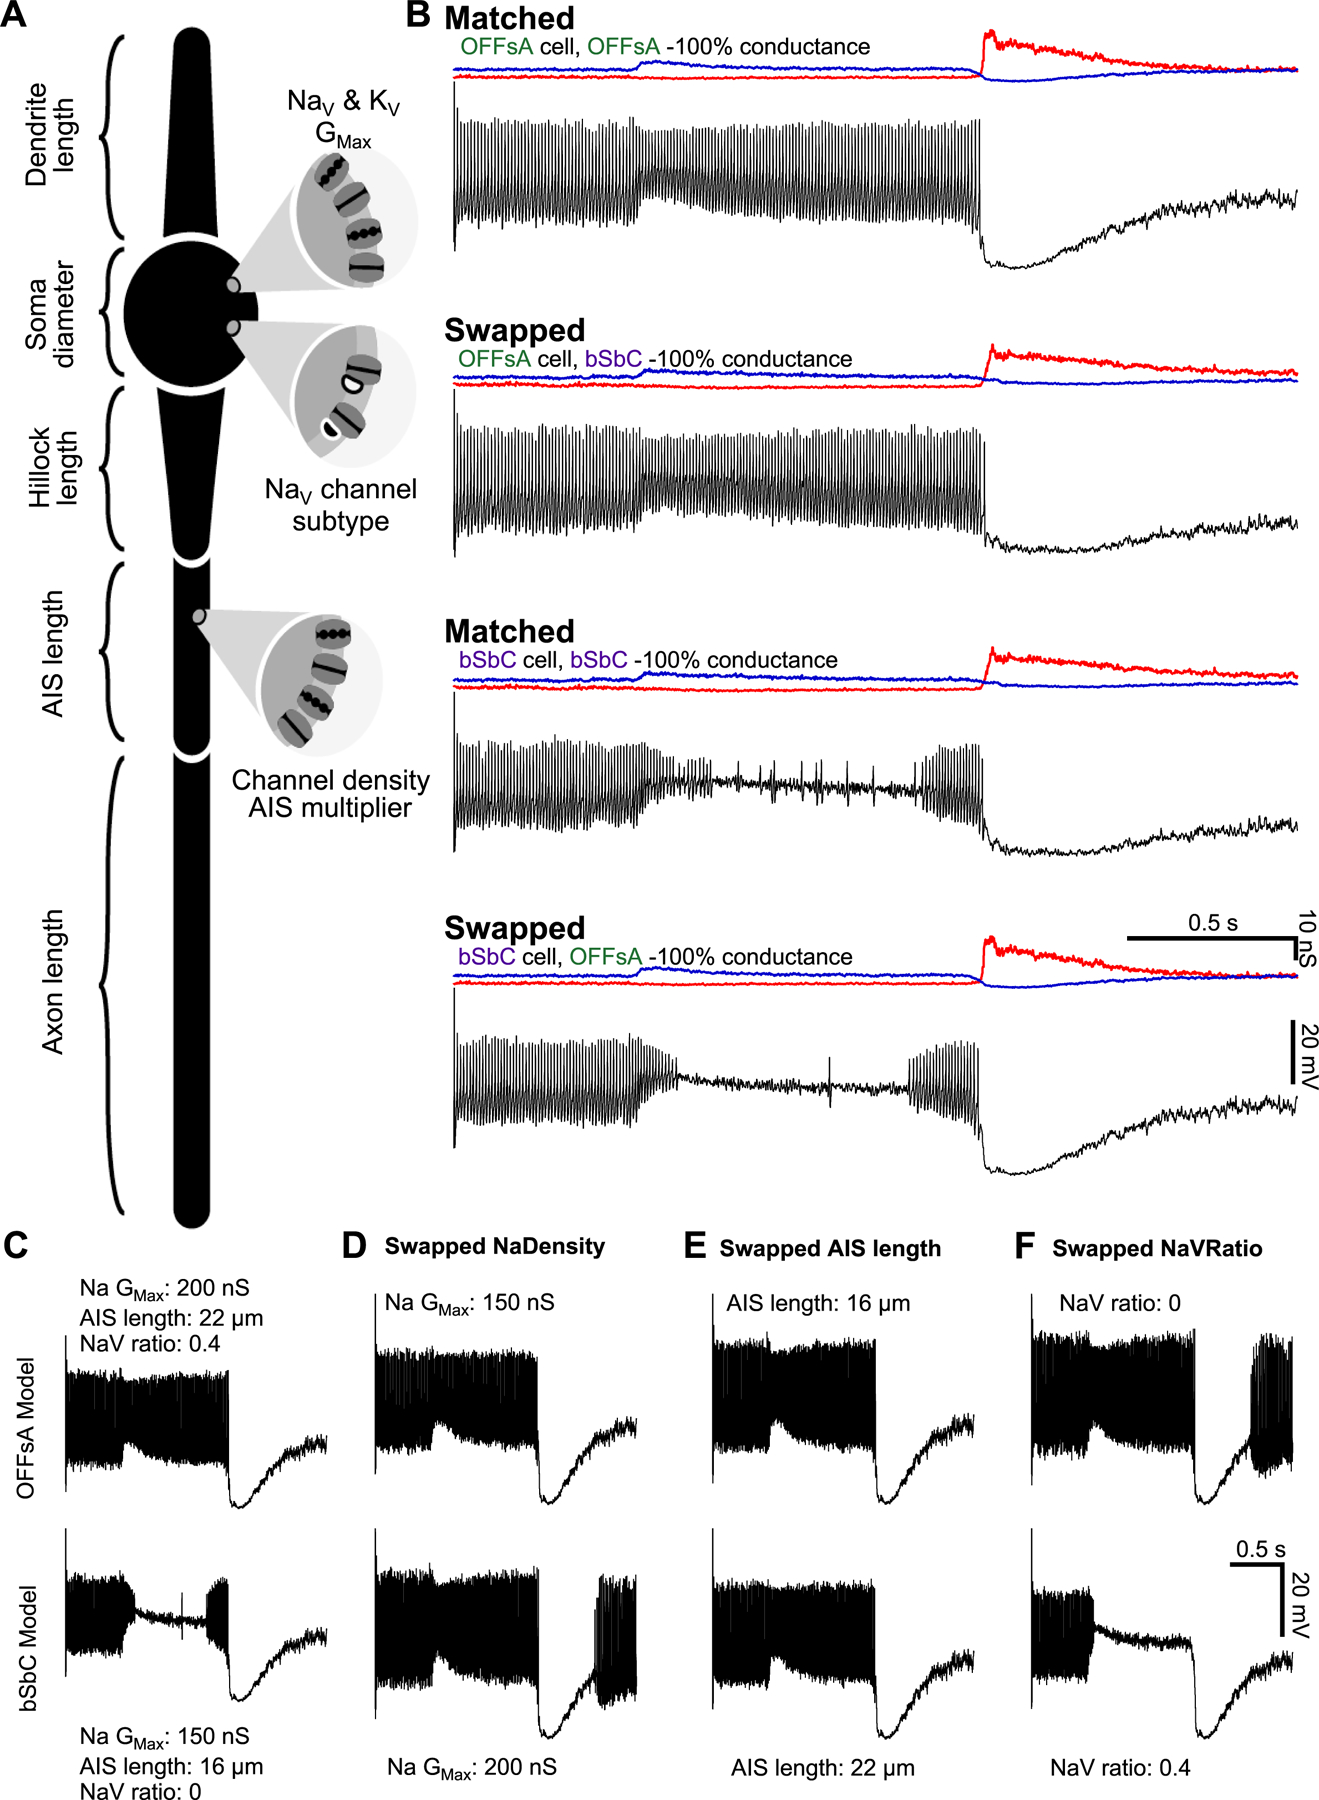
Figure 7. Modeling demonstrates the interplay of sodium channel properties with morphological properties and their effect on cell excitability.

(A) Model schematic labeling most of the key parameters. Values for all parameters can be found in Table 1.
(B) OFFsA and bSbC models that only differ in their AIS length (OFFsA = 22 μm, bSbC 16 μm), ratio of NaV1.6 (OFFsA = 40%, bSbC = 0%), and the total sodium conductance of the cell (OFFsA = 200 nS, bSbC = 150 nS). Then each cell was injected with the conductances measured in Figure S2 and the spiking outputs are shown in black. Excitatory (blue) and inhibitory (red) input conductances are shown above each trace. See also Table S1.
(C-F) Traces for the OFFsA model (top row) and bSbC model (bottom row) in response to current injections. In (D-F) the parameters for sodium channel total conductance for the cell (D), AIS length (E), and the ratio of NaV1.6 channels (F) were swapped between the OFFsA and bSbC models.
