

Summary
Social gaze interaction powerfully shapes interpersonal communication. However, compared to social perception, very little is known about the neuronal underpinnings of real-life social gaze interaction. Here, we studied a large number of neurons spanning four regions in primate prefrontal-amygdala networks and demonstrate robust single-cell foundations of interactive social gaze in the orbitofrontal, dorsomedial prefrontal, and anterior cingulate cortices, in addition to the amygdala. Many neurons in these areas exhibited high temporal heterogeneity for social discriminability, with a selectivity bias for looking at a conspecific compared to an object. Notably, a large proportion of neurons in each brain region parametrically tracked the gaze of self or other, providing substrates for social gaze monitoring. Furthermore, several neurons displayed selective encoding of mutual eye contact in an agent-specific manner. These findings provide evidence of widespread implementations of interactive social gaze neurons in the primate prefrontal-amygdala networks during social gaze interaction.
Keywords: Real-life social gaze interaction, naturalistic behavior, prefrontal-amygdala networks, orbitofrontal cortex, dorsomedial prefrontal cortex, anterior cingulate cortex, basolateral amygdala, social gaze monitoring, mutual eye contact, non-human primates
eTOC Blurb
Dal Monte and Fan et al. investigated single-neuron mechanisms of real-life social gaze interaction in multiple regions in the prefrontal-amygdala networks. Many neurons with high temporal heterogeneity tracked the gaze of self or other and showed mutual gaze selectivity, supporting widespread implementations of interactive social gaze neurons in the networks.
Introduction
Social behaviors involve both social perception, where each individual observes and gains information about others, and social interaction, where multiple individuals dynamically send and receive behavioral signals to and from one another and make social gaze decisions over time (Argyle and Cook, 1976; Emery, 2000; Risko et al., 2016). The hallmark of primate species is their complex social gaze behaviors that consequentially determine their predominantly visually guided social interactions, serving unique functions in non-verbal communications. In both humans and non-human primates, interindividual gaze exchanges make up large parts of interactive behaviors that emerge early on in life and constitute the first dialogue for an infant, helping establish a bond between mother and child and setting the groundwork for sociality in the future (Feldman, 2007). While a great deal of knowledge exists on the neural bases of social perception, often from using two-dimensional static image or video stimuli (Haxby et al., 2000), the single-neuron foundation of naturalistic, face-to-face, social gaze interaction is surprisingly unexplored, even though social gaze interaction is one of the most fundamental social behaviors we carry out numerous times daily.
Emerging evidence supports that the naturalistic context in which we interact with others is critical in shaping social gaze behaviors. Recently, several innovative human studies have begun to use naturalistic, real-time settings to examine social gaze interaction (Freeth et al., 2013; Pönkänen et al., 2011; Schilbach et al., 2013) (reviewed in Fan et al., 2021). Specifically, humans tend to perceive and rate real-life social gaze differently than gaze depicted in pictures (Hayward et al., 2017). In addition, humans’ gaze behaviors in response to the modifications of an experimenter’s gaze direction were altered exclusively during real-life interaction but not video-based interaction (Freeth et al., 2013). Moreover, an increase in face-sensitive event-related potentials from electroencephalography because of direct eye contact was specific to when interacting with a real partner but not when viewing a face shown on a monitor (Pönkänen et al., 2011). Monkeys also display distinct gaze behaviors when interacting with a real-life conspecific compared to looking at the same monkey in images or videos (Dal Monte et al., 2016). Compared to the picture and video conditions, interacting with a real conspecific was associated with a higher proportion of fixations to the eyes, a smaller dispersion of fixations around the eyes, and unique dominance- and familiarity-induced modulations in social gaze dynamics (Dal Monte et al., 2016).
Real-life social gaze interactions rely upon (a) the ability to discriminate social agents from non-social objects, (b) continuous monitoring of the gaze of self or other (Hari et al., 2015; Redcay and Schilbach, 2019), and (c) making instantaneous decisions to look toward or away from others in behaviorally contingent and communicative manners (Shepherd and Freiwald, 2018). Where and how these key variables of social gaze interaction are computed in the brain remains an open question. Here we leveraged naturalistic and spontaneous social gaze exchanges in pairs of macaques to examine single-neuron representations of real-life interactive social gaze. We investigated single-cell spiking activity in four distinct regions in the primate prefrontal-amygdala networks – the orbitofrontal cortex (OFC), the dorsomedial prefrontal cortex (dmPFC), the gyrus of the anterior cingulate cortex (ACCg), and the basolateral amygdala (BLA). We targeted these regions due to their critical functions in the primate social interaction networks, a collection of regions that exhibited selective neural activation patterns when monkeys watched videos of social interactions among conspecifics (Freiwald, 2020). Additionally, these areas are strongly implicated in social behavioral functions across species (reviewed in Gangopadhyay et al., 2021). Research in humans, monkeys, and rodents is beginning to converge to suggest how these areas in the prefrontal-amygdala networks mediate social perception, learning, and reward valuation under different social contexts to guide social decisions and actions (Gangopadhyay et al., 2021).
In the current study, we focused on determining neuronal bases of three key signatures of social gaze interaction, namely social discriminability (discriminating social from non-social stimuli), social gaze monitoring (parametric tracking of the gaze of self or other), and mutual eye contact selectivity (differentiating mutual from non-mutual gaze as well as the initiator and follower of mutual eye contact) in OFC, dmPFC, ACCg, and BLA populations. We found that interactive social gaze neurons, revealed by examining the three core signatures during real-life social gaze interaction, are widely and robustly implemented in the primate prefrontal-amygdala networks, supporting a view that ethologically important behaviors, such as social gaze interaction, recruit broadly distributed neuronal populations in the primate brain.
Results
Six pairs of rhesus macaques (M1: recorded monkey, ‘self’; M2: partner monkey, ‘other’) engaged in dyadic face-to-face social gaze interaction (Dal Monte et al., 2016, 2017) while the eye positions of both monkeys were simultaneously and continuously tracked at high temporal and spatial resolution (Fig. 1a, Fig. S1; STAR Methods). We quantified spontaneously occurring gaze behaviors in four regions of interest (ROIs): the Face, Eyes, and Non-eye Face (face excluding the eye regions) of a conspecific partner, as well as a non-social Object (Fig. 1a–b). Replicating the significance of gaze directed to face and eyes in humans and non-human primates (Dal Monte et al., 2016; Gothard et al., 2004; Itier and Batty, 2009; Kano et al., 2018), we found that the total number of fixations was higher and the average duration of each fixation was longer when monkeys explored partner’s Eyes compared to Non-eye Face or Object (all p < 0.0001, Wilcoxon sign rank, two-sided, FDR-corrected) and when they explored Non-eye Face compared to Object (both p < 0.0001) (Fig. 1c). Monkeys displayed consistent fixation behaviors while exploring different ROIs. They were more likely to look at the partner compared to non-social stimuli after fixations to the partner, and similarly, more likely to look at the non-social compared to social stimuli after fixations to Object (Fig. 1d), likely due to the natural proximity of consecutive fixations. Saccade kinematics were comparable for Eyes, Non-eye Face, and Object (Fig. 1e; STAR Methods). This setting thus reliably captured visual social attention during real-life social gaze interaction.
Figure 1. Experimental setup, social gaze behaviors, and recording sites.
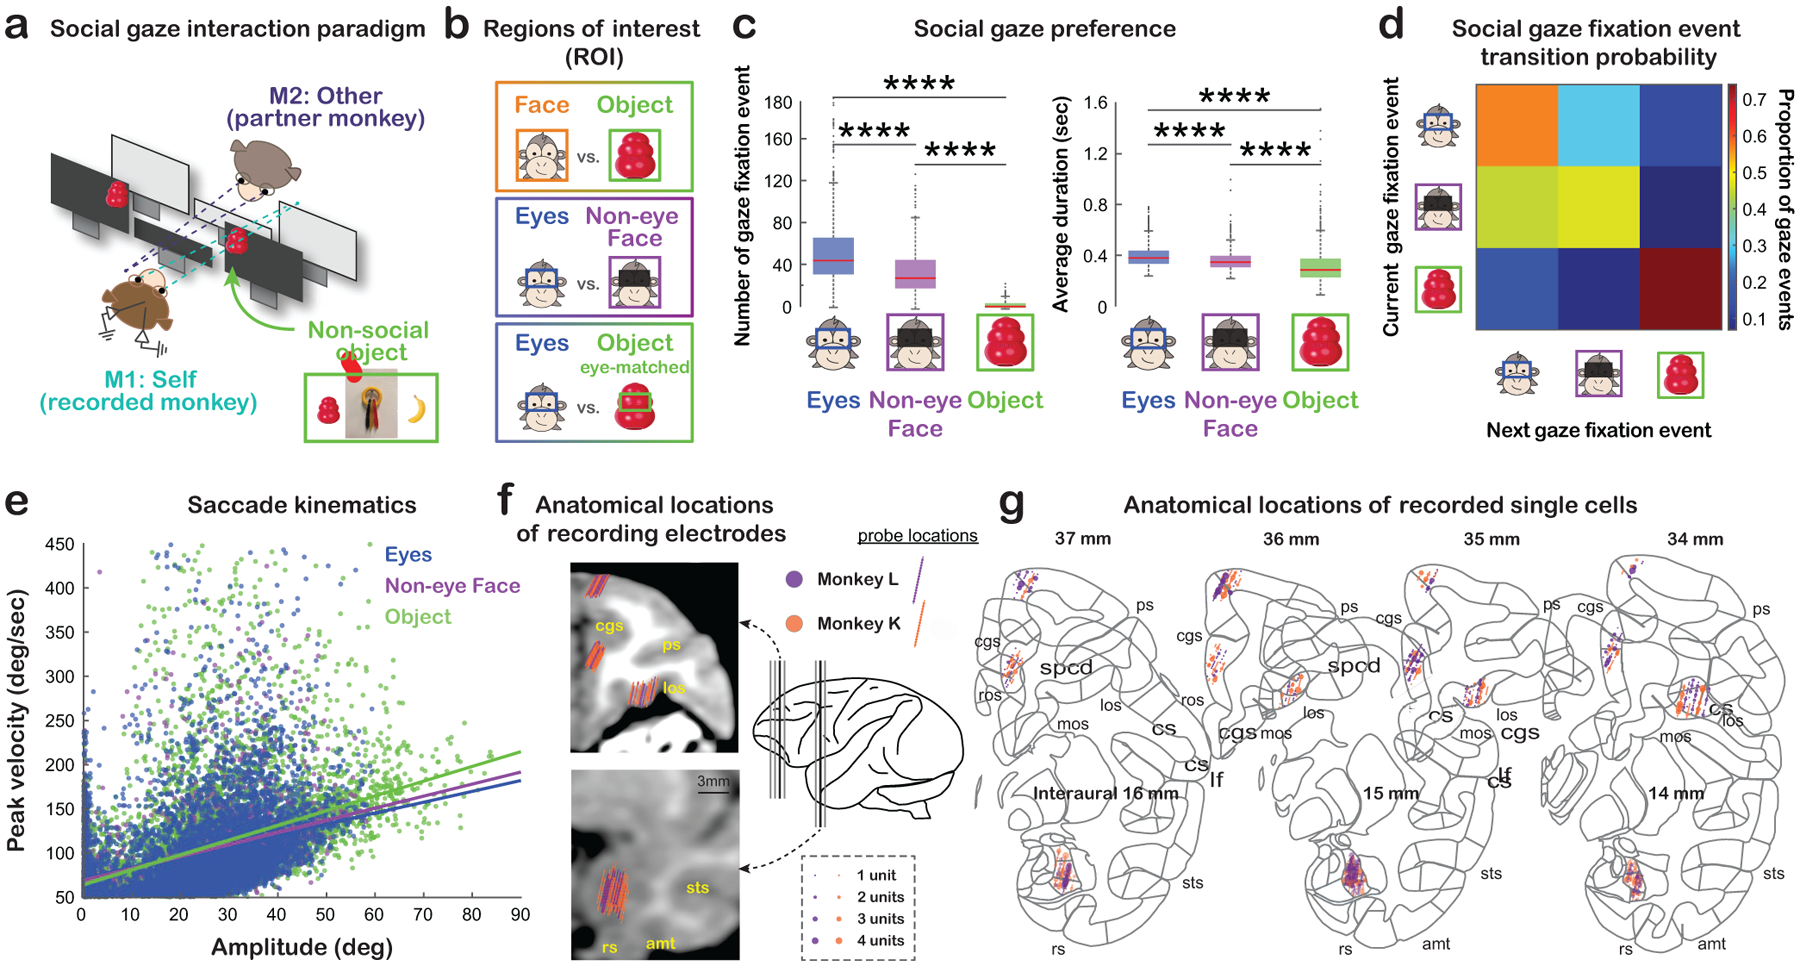
(a) Experimental paradigm for studying naturalistic, face-to-face, social gaze interaction. The inset shows three different types of non-social objects used. Also see Fig. S1. (b) Illustrations of the gaze ROIs and contrasts. (c) Social gaze preference, indicated as the total number of fixations and the average duration per fixation to Eyes, Non-eye Face and Object. ****, p < 0.0001, Wilcoxon sign rank, two-sided, FDR-corrected. (d) Social gaze fixation event transition probability for pairs of current and next fixations to Eyes, Non-eye Face and Object. The number in each cell shows the average frequency of a particular transition across days. (e) Saccade kinematics quantified by peak velocity and amplitude for all saccades to Eyes (blue), Non-eye Face (purple), and Object (green) (lines, linear regression). (f) Anatomical locations of electrode positions from monkey L (purple) and monkey K (orange) on representative coronal MRI slices of monkey K (black thick lines in the brain illustration) (cgs, cingulate sulcus; ps, principal sulcus; los, lateral orbitofrontal sulcus; sts, superior temporal sulcus; amt, anterior middle temporal sulcus; rs, rhinal sulcus). (g) Anatomical locations of recorded single cells in OFC, dmPFC, ACCg, and BLA. Recording locations from monkey L and monkey K are projected onto the standard stereotaxic coordinates of the rhesus macaque brain atlas (Paxinos et al., 1999). Four representative coronal slices with 1-mm interaural spacing were chosen for the three prefrontal areas and three representative coronal slices were chosen for BLA (same as the slices indicated in f).
Robust social discriminability with high temporal heterogeneity in prefrontal and amygdalar neurons during real-life social gaze interaction
We recorded spiking activity from 241 OFC, 187 dmPFC, 236 ACCg, and 537 BLA neurons during real-life social gaze interactions (Fig. 1f–g). We found three broad classes of responses. Some cells categorically fired more for looking at Face compared to Object while showing indifferent activity between Eyes and Non-eye Face (Fig. 2a, panel i). Another group of cells further differentiated Eyes from Non-eye Face (Fig. 2a, ii). Finally, a third group showed higher activity for Object than social ROIs (Fig. 2a, iii).
Figure 2. Single-neuron responses to gaze fixation events, population summary with social discriminability and face feature discriminability, and control analyses.
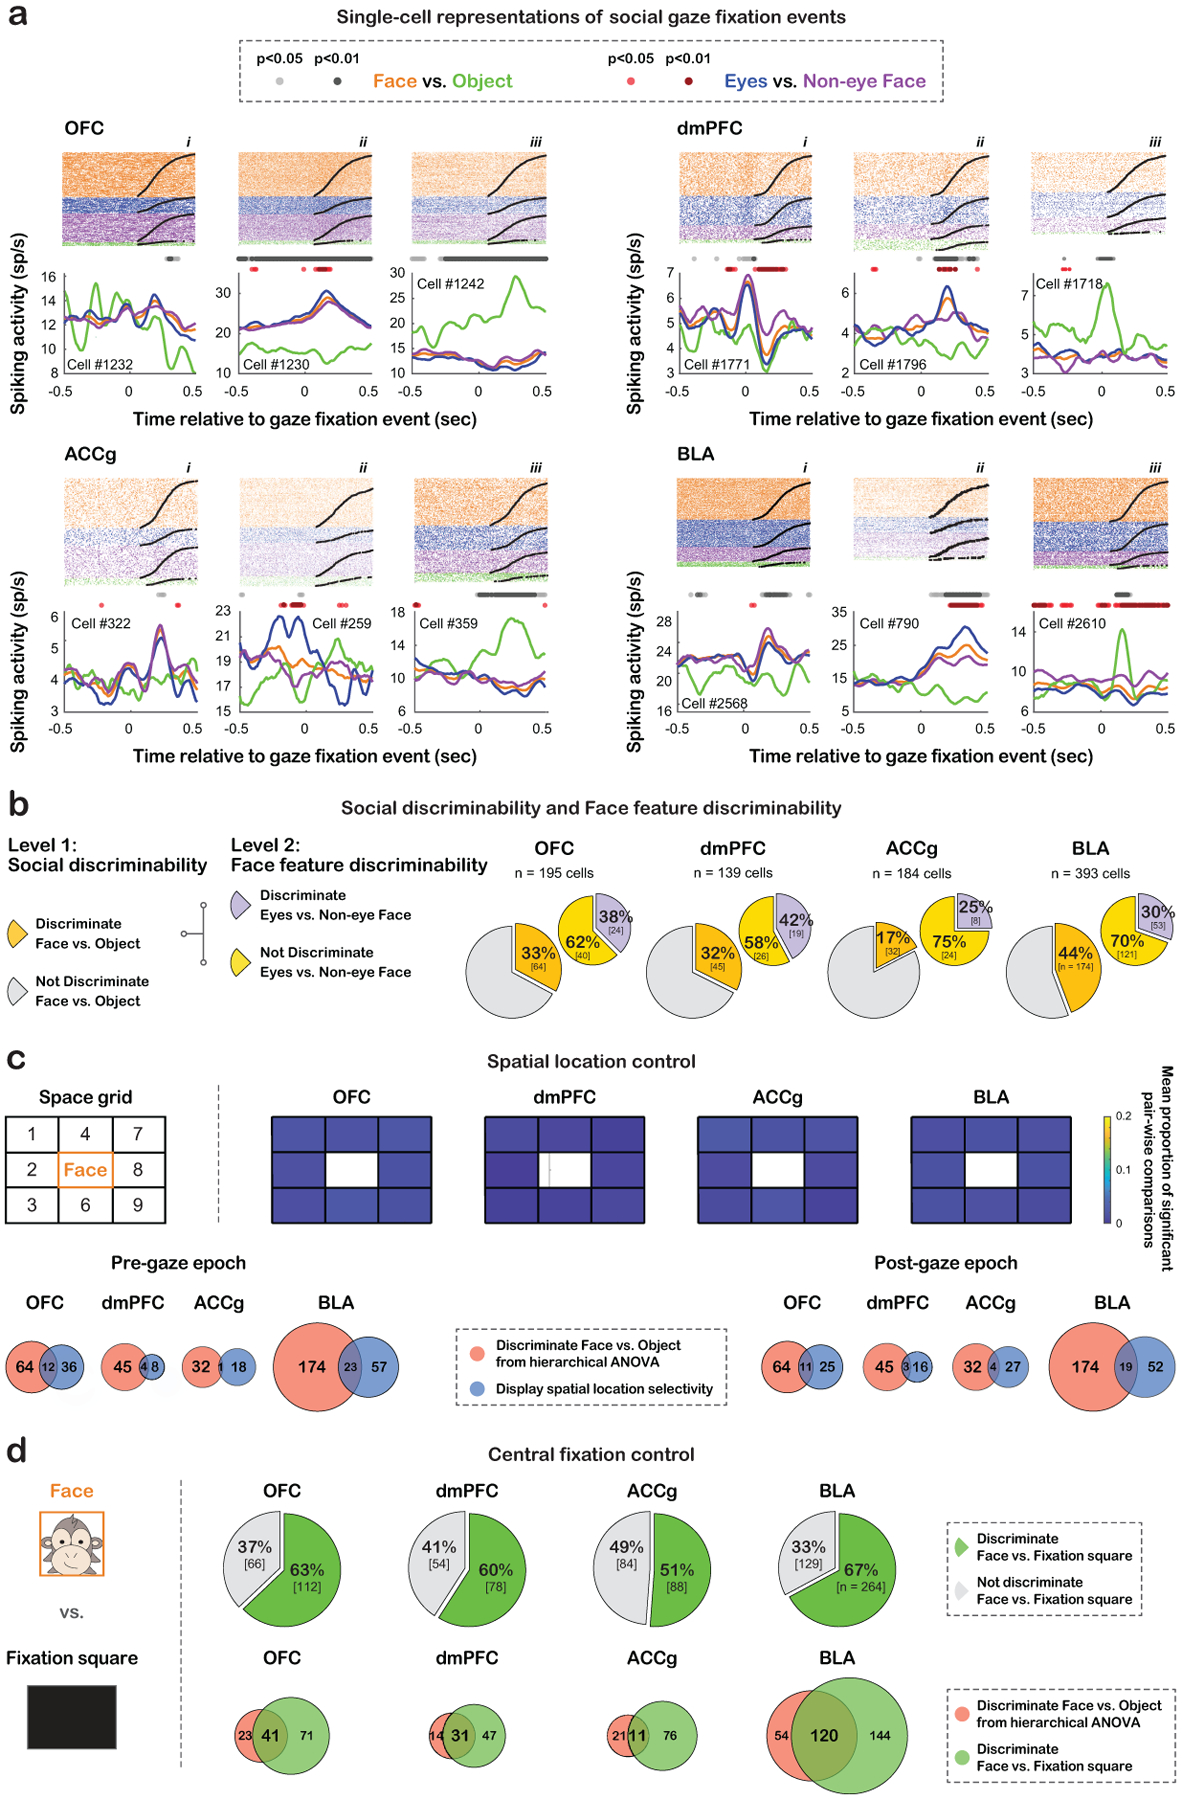
(a) Single-cell examples of spiking activity around gaze fixation events. Spike rasters are shown at the top, and the peristimulus time histograms (PSTH) show the average activity aligned to the onset of fixation events (orange: Face; blue: Eyes; purple: Non-eye Face; green: Object). Light gray (p < 0.05, hierarchical ANOVA) and dark gray (p < 0.01) circles indicate time bins with significantly different activity for Face vs. Object. Light red (p < 0.05) and dark red (p < 0.01) circles indicate time bins with significantly different activity for Eyes vs. Non-eye Face. (b) Hierarchical classification of cells with social discriminability (Face vs. Object) and face feature discriminability (Eyes vs. Non-eye Face). Larger pies show the proportions of cells with (dark yellow) and without (gray) social discriminability. Smaller pies show the proportions of cells with social discriminability that further showed (purple) and did not show (light yellow) face feature discriminability. (c) Spatial location control. Top left, a 9-cell space grid (labeled as 1–9) constructed to be centered on partner monkey’s Face. We compared neural activity around current Face events when the previous fixations fell within different grids. Heatmaps show the mean proportions of significant pair-wise comparisons of activity among the 8 grids. Within each grid, the values on the bottom left and top right represent the proportions for the pre- and post-gaze epochs, respectively. None of the 8 grid cells showed any meaningful proportions – across the four areas, the mean proportion of 32 cases for pre-gaze epoch was 0.009 ± 0.005 (mean ± std) and that of 32 cases for post-gaze epoch was 0.01 ± 0.004. Thus, the location of the previous fixations did not modulate activity for looking at Face. Venn diagrams show very small overlaps between cells that discriminated Face from Object (hierarchical ANOVA) (red) and cells that discriminated space grids (blue) for all brain regions for the pre-gaze epoch (left: out of cells that discriminated Face from Object, 16% of OFC, 8% of dmPFC, 3% of ACCg, and 12% of BLA) and post-gaze epoch (right: out of cells with social discriminability, 15% of OFC, 6% of dmPFC, 11% of ACCg, and 10% of BLA). The small overlap supports that distinct activity for Face vs. Object was unlikely due to their different spatial locations, because the majority of neurons with social discriminability did not show spatial selectivity. (d) Central fixation control. Activity for Face was compared to looking at a white central Fixation square on the middle monitor during inter-session breaks (left, STAR Methods), both located in the central fixation location of the recorded monkey. Pie charts show the proportion of cells in each region that significantly discriminated Face from Fixation square (green) and those that did not (gray). Many cells differentiated the two stimuli, both appearing directly in front of the recorded monkey. Venn diagrams on the bottom right show overlaps between cells that discriminated Face from Object (hierarchical ANOVA) (red) and cells that discriminated Face from Fixation square (green) for all regions (out of cells with social discriminability, 64% of OFC, 69% of dmPFC, 34% of ACCg, and 69% of BLA). The large overlap supports that distinct activity for Face vs. Object was mainly due to the differentiation of social vs. non-social stimuli and that neurons with social discriminability would still likely to show different activity for Face and Object even when both stimuli were positioned in the same location, because many of them differentiated social (Face) vs. non-social stimuli (Fixation square) when positioned in the same spatial location.
All four brain regions in the prefrontal-amygdala networks contained considerable proportions of cells exhibiting ‘social discriminability’, defined as showing distinct activity for Face ROI versus [vs.] Object ROI (33% of OFC, 32% of dmPFC, 17% of ACCg, and 44% of BLA) (Fig. 2b; hierarchical ANOVA; STAR Methods). These responses were mainly driven by social vs. non-social differentiation and unlikely due to the different spatial locations of the two stimuli in our setting (Fig. 2c–d). Among the three prefrontal regions, OFC and dmPFC showed higher proportions of cells with social discriminability than ACCg (Fig. 2b; OFC vs. ACCg: χ2= 11.92, p < 0.001; dmPFC vs. ACCg: χ2= 9.79, p < 0.005, Chi-square, FDR-corrected), while BLA showed the highest proportion of such neurons (BLA vs. OFC: χ2= 7.10, p < 0.01; BLA vs. dmPFC: χ2= 6.00, p = 0.02; BLA vs. ACCg: χ2= 39.46, p < 0.0001; Chi-square, FDR-corrected). Among these cells with social discriminability, comparable proportions of cells across the four brain areas further displayed ‘face feature discriminability’, defined as showing distinct activity for Eyes ROI vs. Non-eye Face ROI (38% of OFC, 42% of dmPFC, 25% of ACCg, and 30% of BLA) (Fig. 2b; hierarchical ANOVA; all χ2 < 2.44, p > 0.40, Chi-square, FDR-corrected). Notably, except for dmPFC (p = 0.16, χ2 = 2.18), higher proportions of OFC, ACCg, and BLA cells discriminated only Face from Object compared to additionally discriminating Eyes from Non-Eye Face (all p < 0.01, χ2 > 8.00), suggesting a preference of categorical over feature-specific distinction. Further, while individual cells displayed diverse activity modulations by various gaze events, at the population level, all four regions nevertheless exhibited greater mean activity for Eyes and Face, compared to Object (Fig. S2a, all p < 0.0001, Tukey test), demonstrating an overall bias for a social agent over non-social stimulus.
Interestingly, in all four areas, the time points at which individual cells began to differentiate looking at social vs. non-social stimuli (Fig. 3a for Face vs. Object, Fig. S2b for Eyes vs. Object) or different face features (Fig. 3b for Eyes vs. Non-eye Face) varied greatly based on the receiver operating characteristic analysis – some cells started to show distinct activity for different ROIs before and leading up to fixation events (pre-gaze epoch: 500 msec leading up to the time of gaze fixation event onset), while other cells displayed distinct activity when the fixation events had already begun (post-gaze epoch: 500 msec following the time of gaze fixation event onset). A time-to-peak analysis (Fig. S3a–c; STAR Methods) revealed that when differentiating social vs. non-social category, the BLA population showed peak activity at a later time point for Face compared to Object, whereas the three prefrontal areas showed no difference in the timing of peak activity (Fig. S3a; p < 0.0001 for BLA, p > 0.051 for the other areas, Wilcoxon rank sum, two-sided). By contrast, when differentiating face features, only the ACCg population displayed peak activity later for Eyes compared to Non-eye Face (Fig. S3c; p < 0.005 for ACCg, all p > 0.17 for the other areas). We also examined the time of peak activity for each ROI. There was a main effect of brain region for Face (p = 0.02, ANOVA), with BLA cells displaying average peak activity later than dmPFC (p = 0.04, Tukey), as well as for Non-eye Face (p < 0.0005, ANOVA), with BLA and OFC cells displaying average peak activity later than ACCg and dmPFC (BLA vs. ACCg: p < 0.005; BLA vs. dmPFC: p < 0.005; OFC vs. ACCg: p = 0.02; OFC vs. dmPFC: p = 0.02, Tukey). By contrast, there was no brain area difference in the peak spiking time for Eyes or Object (Eyes: p = 0.31; Object with matching ROI size as Eyes: p = 0.32; Object with matching ROI size as Face: p = 0.78, ANOVA). Further, a separate spike latency analysis (STAR Methods) showed that neurons tended to show distinct activity for Face later than Object (Fig. S3d; all p < 0.003, Wilcoxon rank sum, two-sided) and for Eyes later than Object (Fig. S3e; all p < 0.001). By contrast, when differentiating face features, only BLA showed distinct activity for Eyes later than Non-eye Face (Fig. S3f; p = 0.001). However, we did not observe regional difference in spike latency (all p > 0.05, ANOVA). In sum, although the receiver operating characteristic, time-to-peak, and spike latency analyses revealed complex temporal profiles, they were consistent in supporting that OFC, dmPFC, ACCg, and BLA neurons show social discriminability, with some further showing face feature discriminability, with high temporal heterogeneity across cells and brain regions.
Figure 3. Temporal characteristics of social gaze signals and population decoding.
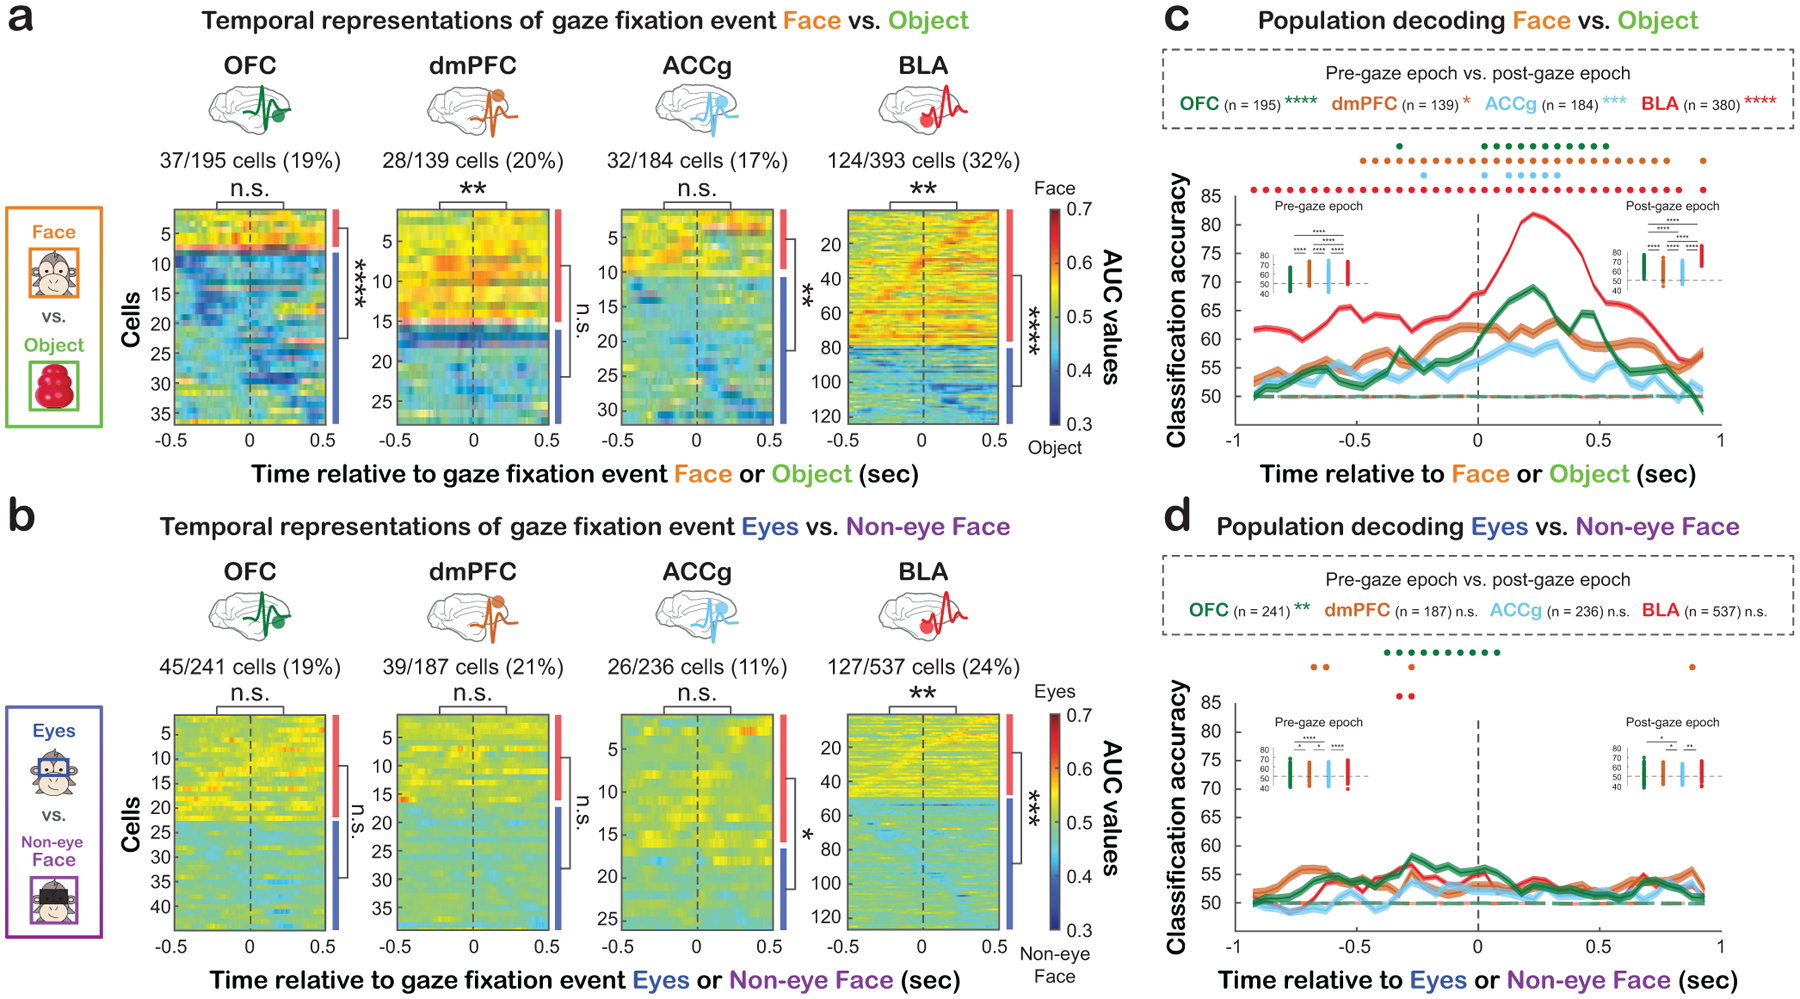
(a) Temporal profiles for discriminating Face vs. Object with matching ROI sizes. Heatmaps show the area under the curve (AUC) values from receiver operating characteristic (ROC) analysis for significantly discriminating Face from Object. Data are aligned to the time of fixation event onset with each row representing a cell sorted by the first bin with significant AUC (white contour). Warm colors indicate greater activity for looking at Face (AUC > 0.5), whereas cold colors indicate greater activity for Object (AUC < 0.5). The asterisks on the top of each heatmap indicate the comparison of the proportions of cells that began discriminating Face vs. Object during the pre-gaze versus post-gaze epoch. The red and blue bars to the right represent the proportions of cells with greater activity for Face and Object, respectively. ** p < 0.01, **** p < 0.0001, n.s, not significant, Chi-square, FDR-corrected. (b) Temporal profiles for discriminating Eyes vs. Non-eye Face. Same format as (a). * p < 0.05, ** p < 0.01, *** p < 0.001, n.s, not significant, Chi-square, FDR-corrected. (c) Population decoding accuracy for Face vs. Object in OFC (green), dmPFC (brown), ACCg (blue), and BLA (red). Real data are shown in solid lines and empirically derived null data are shown in dotted lines. Circles at the top indicate time bins with decoding accuracy significantly higher than the null in corresponding colors (p < 0.001, permutation test). Asterisks next to the number of cells in the box indicate the significance of comparing classification accuracy between the pre- and post-gaze epochs (Wilcoxon sign rank, two-sided, FDR-corrected). * p < 0.05, *** p < 0.001, **** p < 0.0001. Comparisons of classification accuracy across regions are shown in the inset bar plots (Wilcoxon rank sum, two-sided, FDR-corrected). Each data point represents the median classification accuracy of an iteration. ****, p < 0.0001. (d) Population decoding accuracy for Eyes vs. Non-eye Face. Same format as (c). * p < 0.05, ** p < 0.01, **** p < 0.0001, n.s, not significant. See Fig. S2b–c for the same analyses for Eyes vs. Object and Fig. S2d for population decoding using a matching number of cells across regions. See Fig. S3 for additional temporal profile analyses.
By training the max correlation coefficient (MCC) pattern classifier (STAR Methods), we found that population activity in OFC, dmPFC, and BLA could be used to robustly decode social vs. non-social gaze fixation events (Fig. 3c for Face vs. Object, Fig. S2c for Eyes vs. Object). However, we detected weaker decoding accuracy in ACCg (Fig. 3c, Fig. S2c). The population classifier was able to better decode looking at Face vs. Object in the post-gaze compared to the pre-gaze epoch in all four regions (Fig. 3c; p < 0.0001 for OFC and BLA, p < 0.05 for dmPFC, and p < 0.0005 for ACCg; Wilcoxon sign rank, FDR-corrected). The classifier was also able to better decode Eyes vs. Object during the post-gaze epoch in OFC, dmPFC, and BLA (Fig. S2c; p < 0.0001 for OFC, dmPFC, and BLA, p = 0.63 for ACCg). By stark contrast, decoding accuracy was overall near chance in all four regions for Eyes vs. Non-eye Face (Fig. 3d), again endorsing predominant social discriminability over face feature discriminability during live social gaze interaction. There was no difference in decoding accuracy for Eyes vs. Non-eye Face across the two epochs except for OFC with better classification performance in the pre-gaze epoch (Fig. 3d, p < 0.005 for OFC, p > 0.12 for the other three areas; Wilcoxon sign rank, two-sided, FDR-correct). Comparable decoding results were observed when the analyses were performed using the same number of cells across regions (Fig. S2d; STAR Methods).
Together, these results suggest widespread single-cell representations of social gaze events in the prefrontal-amygdala networks with high temporal heterogeneity. These neurons were more involved in differentiating social from non-social stimuli, compared to different face features, during real-life social gaze interaction.
Social gaze monitoring by tracking social gaze distance of self and other
To determine the neural modulations by fixation positions during social gaze interactions in a continuous fashion, we constructed a spike density map for each cell in the visual space surrounding Eyes, Face and non-social Object (STAR Methods) and observed diverse types of modulations across cells (Fig. S4). Nevertheless, at the population level, spike density maps unambiguously demonstrated that all four areas showed greater activity when monkeys looked closer toward a conspecific and less activity when looking farther away from the conspecific (Fig. 4a), raising an intriguing possibility that these neurons might track one’s fixation positions in reference to another social agent. Moreover, in addition to one’s own fixation, successful interactive gaze exchanges require constant monitoring of other’s gaze. For the purpose of monitoring social gaze interaction, neurons might also signal other’s fixation positions relative to oneself. To test if activity in the three prefrontal areas and BLA parametrically tracked the fixation positions of self (M1) and other (M2), we examined each neuron’s spiking modulation by two social gaze-related distance variables – Self-distance (defined as the relative distance between M1’s fixation positions and the center of M2’s eyes projected onto the same plane) and Other-distance (the relative distance between M2’s fixation positions and the center of M1’s eyes) (Fig. 4b; STAR Methods; Eq. 1–2).
Figure 4. Social gaze monitoring from the perspective of self and other.
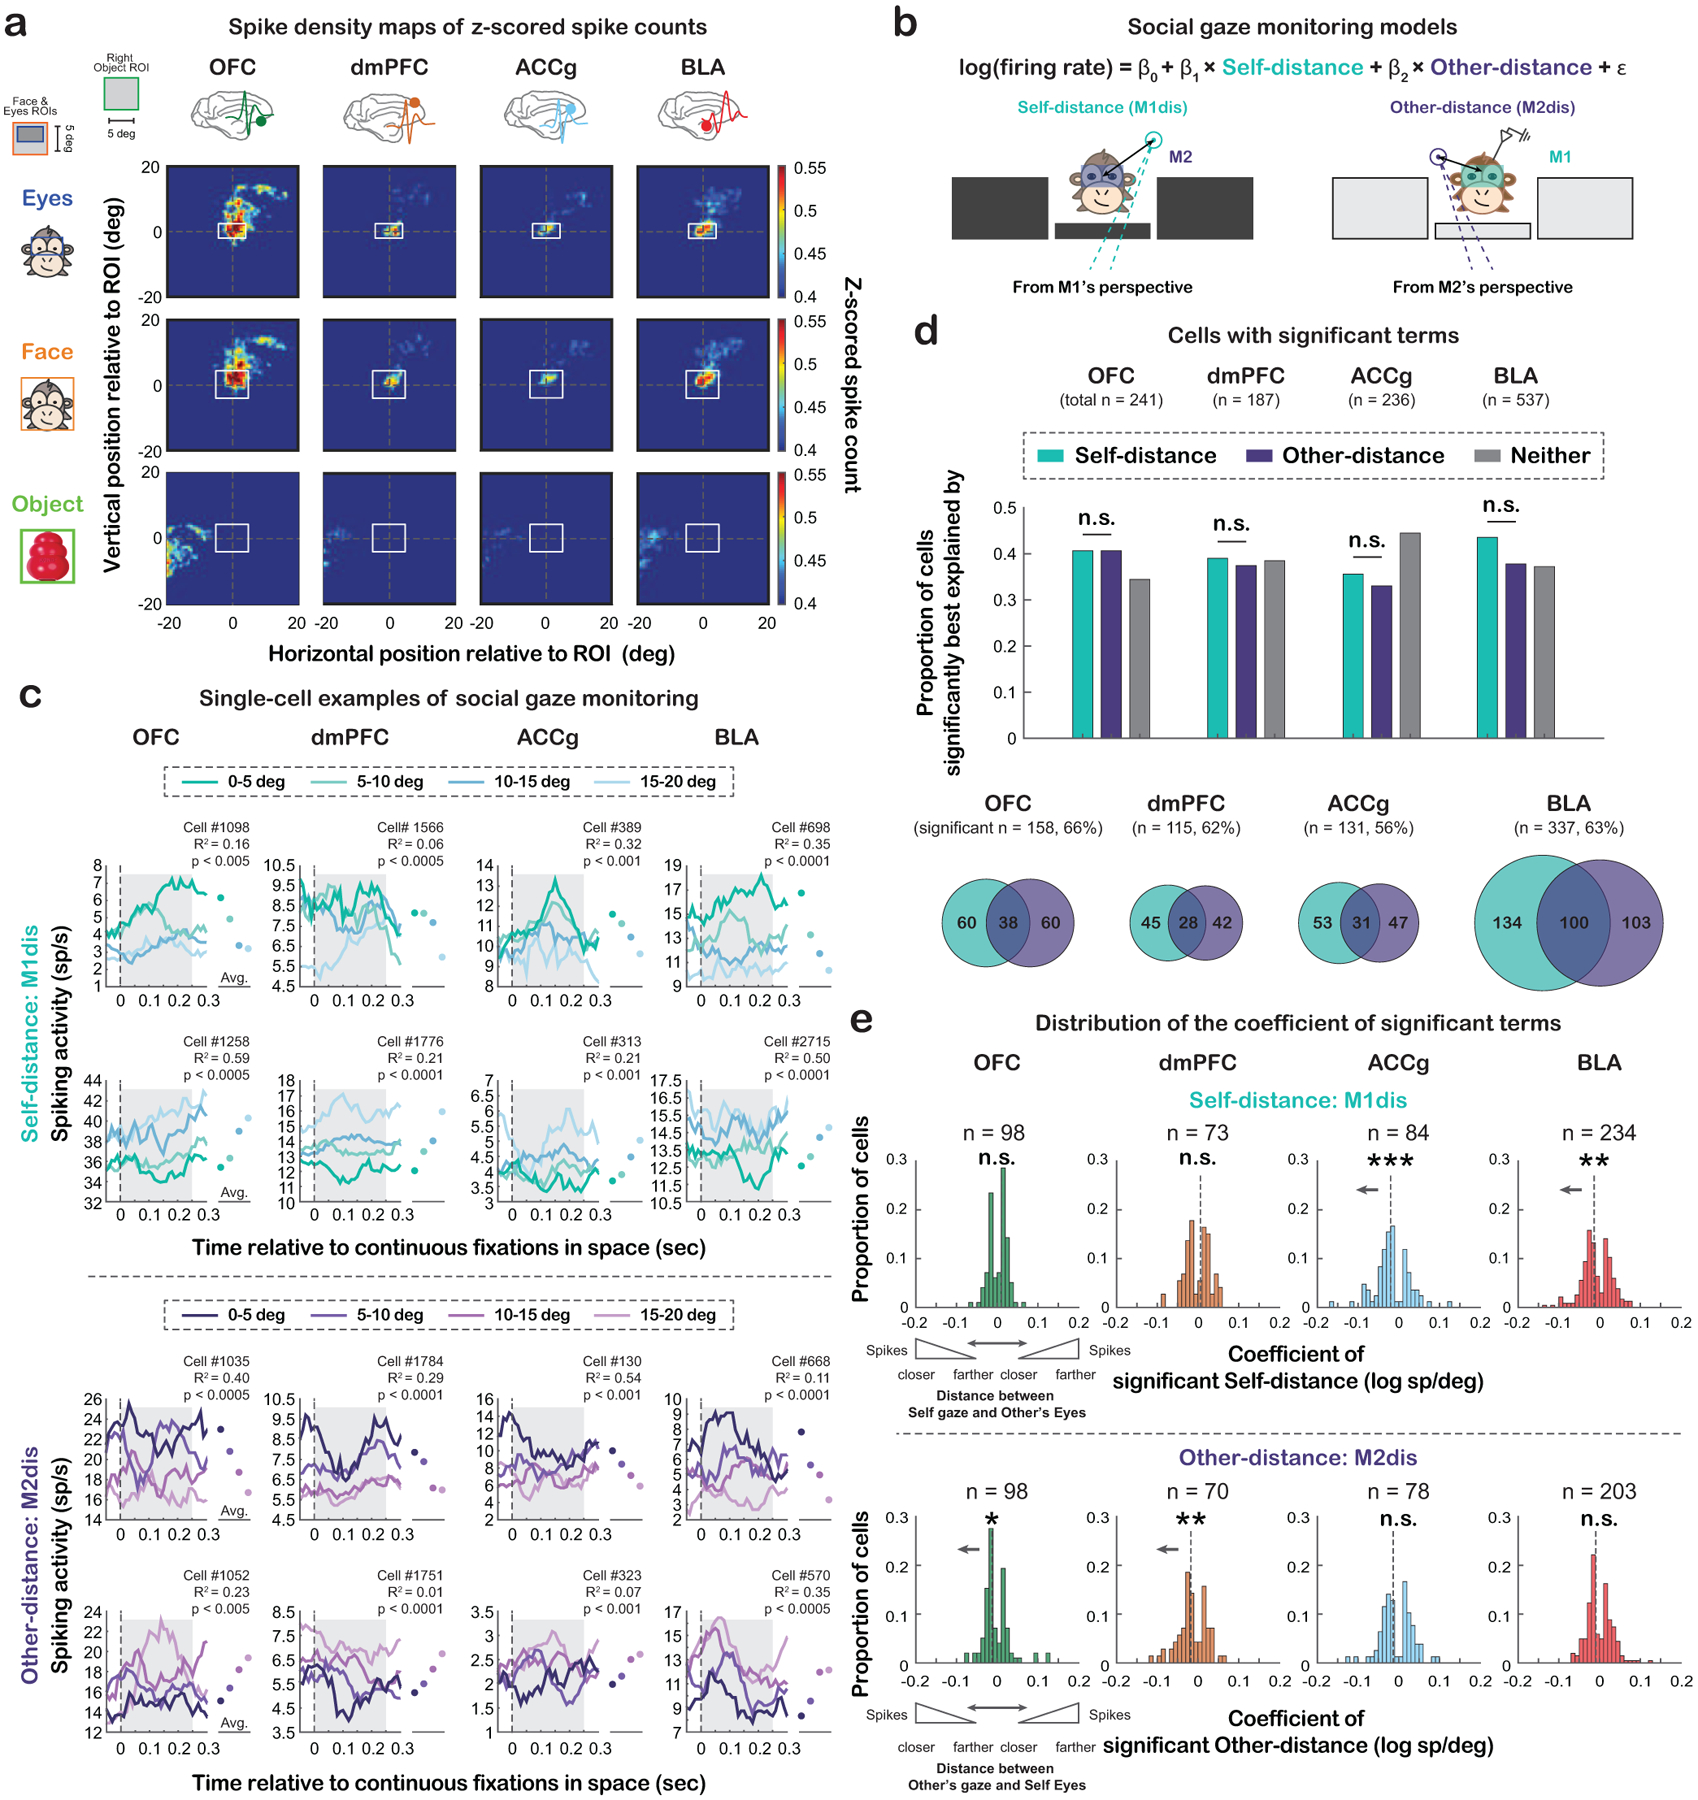
(a) Spike density maps (z-scored spike counts) aligned to the center of Eyes (top), Face (middle) and Object (bottom; matching ROI size as Face). Top left inset, the layout of the setup for reference. See Fig. S4 for single-cell examples of spike density maps. (b) Modeling of social gaze monitoring with illustrations of the two distance variables: Self-distance (M1dis, mint) and Other-distance (M2dis, purple) (STAR Methods; Eq. 1–2). (c) Single-cell PSTH examples from each area whose activity was significantly explained by Self-distance or Other-distance. Both decreasing and increasing modulation types are shown (the top rows: cells firing more with smaller Self-distance or Other-distance; bottom rows: cells firing more with greater Self-distance or Other-distance). The dots on the right in each panel show the mean activity for each distance category during the 250-msec period after fixation onset (shaded area), which was about the average fixation duration per day. (d) Proportion of cells in each area whose activity was significantly explained by Self-distance, Other-distance, or neither (gray). Comparable proportions of cells across the four regions significantly tracked Self-distance (χ2 = 4.60 and p = 0.61, Chi-square, FDR-corrected) and Other-distance (χ2 = 3.04 and p = 0.77, FDR-corrected). When comparing these two proportions within region, all four areas contained comparable proportions of cells that significantly tracked Self-distance and Other-distance (all χ2 < 3.48, p > 0.37, FDR-corrected). n.s, not significant, Chi-square with FDR correction. (e) Distribution of coefficient of neurons that significantly tracked Self-distance (top) or Other-distance (bottom). * p < 0.05, ** p < 0.01, *** p < 0.001, n.s, not significant, Wilcoxon sign rank, two-sided. See Fig. S5d–e for the same analyses by using a subset of cells from days with uncorrelated binned Self-distance and Other-distance.
Notably, in each of the four regions, activity of a substantial proportion of neurons was significantly explained by Self-distance or Other-distance with activity of individual neurons either increasing or decreasing as these distance variables increased (Fig. 4c). Specifically, 41% of OFC, 39% of dmPFC, 36% of ACCg, and 44% of BLA cells significantly tracked Self-distance, where oneself (M1) was looking at a given moment relative to other’s eyes (Fig. 4d, top) with no regional difference (χ2 = 4.60 and p = 0.61, Chi-square, FDR-corrected). More interestingly, activity of 41% of OFC, 37% of dmPFC, 33% of ACCg, and 38% of BLA cells could be significantly explained by Other-distance, tracking the fixation positions of the other monkey (M2) (Fig. 4d, top), again with no regional difference (χ2 = 3.04 and p = 0.77, FDR-corrected). When comparing these two proportions within a given region, all four areas contained comparable proportions of cells that significantly tracked Self-distance and Other-distance (all χ2 < 3.48, p > 0.37, FDR-corrected). These results suggest that numerous cells concurrently tracked both Self-distance and Other-distance (Fig. 4d, bottom). Among neurons that significantly tracked either Self-distance or Other-distance, we generally observed a bimodal distribution of their coefficients across all regions (Fig. 4e), such that while some neurons fired more when the recorded monkey was looking closer to partner monkey’s eyes (negative coefficient of Self-distance) or when the recorded monkey was being looked closer at the eyes by the partner monkey (negative coefficient of Other-distance), other neurons showed the opposite pattern, consistent with single-cell PSTHs (Fig. 4c). ACCg and BLA showed a population bias toward having negative coefficients of Self-distance (Fig. 4e, top; p < 0.0005 and p < 0.005, respectively, Wilcoxon sign rank, two-sided), suggesting that ACCg and BLA populations fired more when the self was looking closely at the other’s eyes. By contrast, OFC and dmPFC populations showed a bias toward showing greater activity when the self was being looked at more closely in the eyes by others (Fig. 4e, bottom; p = 0.03 and p < 0.005, respectively, Wilcoxon sign rank, two-sided). Importantly, our modeling showed good fits at the population level (Fig. S5a; all p = 0 and p < 0.03 for comparing true mean and median of adjusted R2 to shuffled null distribution of mean and median adjusted R2, respectively, permutation test; STAR Methods) and therefore indicates robust neural signals of social gaze monitoring in the prefrontal-amygdala networks. To exclude the possibility that these results were driven by potentially correlated Self-distance and Other-distance behavioral variables from any specific day, we applied the same analyses using only the cells from 28 out of 42 days where binned Self-distance and Other-distance were behaviorally uncorrelated (Fig. S5b–c; p > 0.05, Spearman; STAR Methods) and observed similar results (Fig. S5d–f).
These results support a single-cell mechanism of social gaze monitoring in the prefrontal-amygdala networks for facilitating and guiding social gaze interaction, such that prefrontal and amygdalar neurons not only encode one’s own gaze positions during social gaze interaction, but also monitor other’s gaze positions, the two key components that could be used to compute the gaze fixation offset between where oneself is looking and where other is looking. These social gaze monitoring signals could serve critical functions in representing specific gaze behaviors, such as mutual eye contact.
Agent-specific mutual eye contact selectivity
Given the neural evidence of social gaze monitoring from the perspectives of self and other, we next examined interactive mutual eye contact events. Behaviorally, we observed numerous bouts of gaze exchanges between pairs of monkeys, including both mutual eye contact (Interactive Mutual Gaze; defined as when both individuals looked at each other’s eyes simultaneously) and non-mutual gaze at the eyes (Solo Gaze; defined as when only one monkey in the pair looked at the other’s eyes without any reciprocating gaze from the other) (Fig. 5a–b; STAR Methods). Specifically, we identified two agent-specific contexts of Interactive Mutual Gaze events: Self-follow Mutual Gaze (i.e., M2 looked at M1’s Eyes, followed by M1 looking at M2’s Eyes) and Other-follow Mutual Gaze (i.e., M1 looked at M2’s Eyes, followed by M2 looking at M1’s Eyes) (Fig. 5b; STAR Methods). Behaviorally, there was a large trial-by-trial variation in the latency for the follower monkey to look at the eyes of the other who initiated the mutual eye contact, for both Self-follow and Other-follow Mutual Gaze events, though the distributions of the latency were comparable between the two types (Fig. 5b, right, p = 0.32, Wilcoxon rank sum, two-sided).
Figure 5. Interactive social gaze behaviors and agent-specific mutual eye contact selectivity.
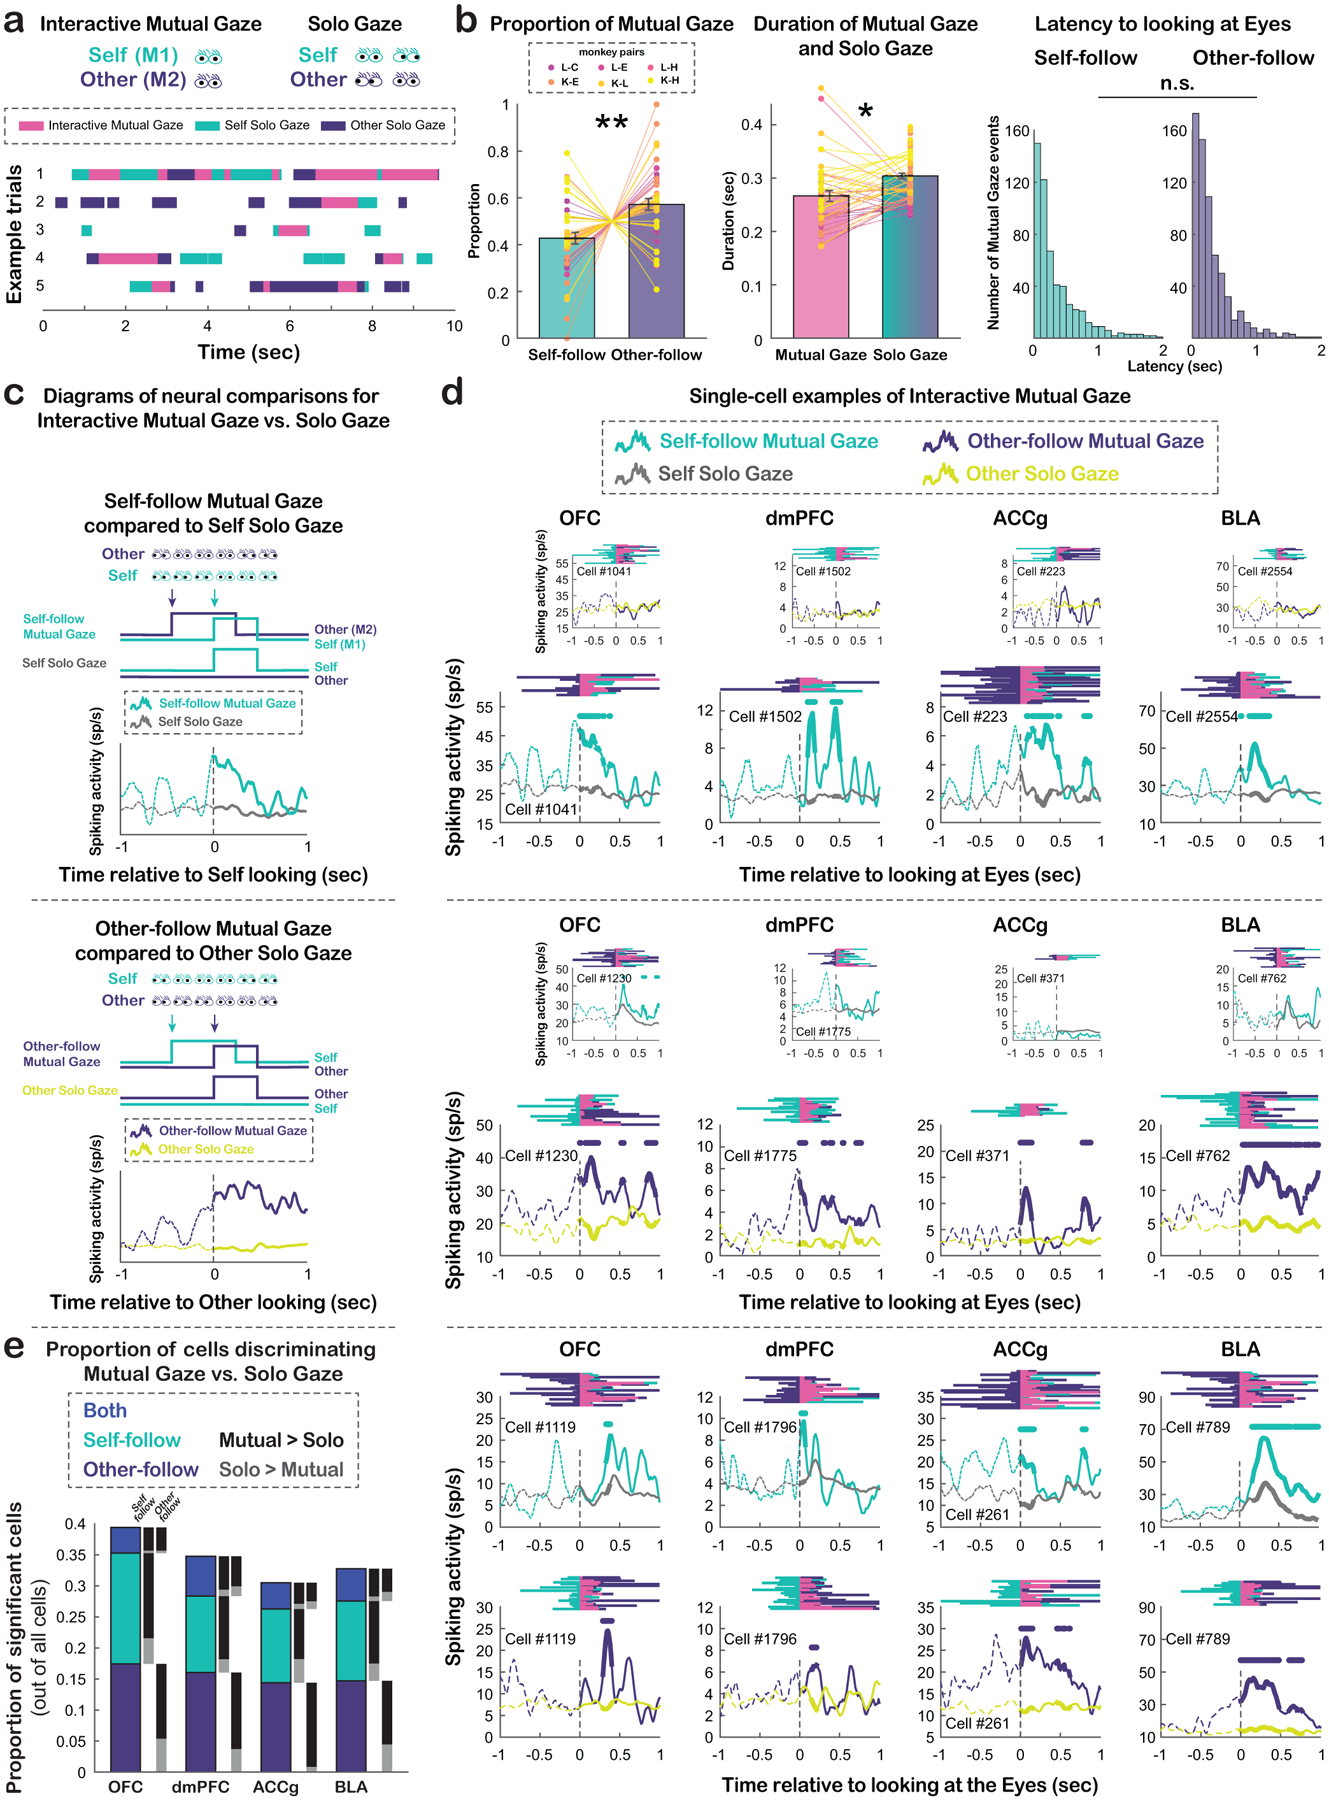
(a) Examples of gaze interaction bouts between pairs of monkeys, including Interactive Mutual Gaze and Solo Gaze events. (b) Proportions of Self-follow and Other-follow Mutual Gaze collapsed across monkeys (left), average durations of Mutual Gaze and Solo Gaze (middle), and behavioral latency distributions of Self-follow and Other-follow Interactive Mutual Gaze (right). * p < 0.05, ** p < 0.01, n.s, not significant, Wilcoxon sign rank, two-sided. (c) Diagrams illustrating the neural comparisons between Self-follow Interactive Mutual Gaze (mint) and Self Solo Gaze (gray), aligned to the time of M1 (self) looking at M2’s (other) eyes, and between Other-follow Interactive Mutual Gaze (purple) and Other Solo Gaze (mustard), aligned to the time of M2 looking at M1’s eyes. See also Fig. S6 a-b. (d) Single-cell PSTH examples of mutual eye contact selectivity. Top, example cells from each area with selectivity exclusively for Self-follow Mutual Gaze (large panels), but not for Other-follow Mutual Gaze (small panels). Middle, example cells with selectivity exclusively for Other-follow Mutual Gaze (large panels), but not for Self-follow Mutual Gaze (small panels). Bottom, example cells with selectivity for both Self-follow Mutual Gaze s and Other-follow Mutual Gaze. For each panel, behavioral rasters are shown on the top (mint: M1 looking at M2’s eyes; purple: M2 looking at M1’s eyes; pink: mutual eye gaze). Each PSTH shows the average activity aligned to the time of Interactive Mutual Gaze and corresponding Solo Gaze. Traces in the analyzed epoch (first 500 msec following fixation event onsets) are shown in solid lines. Circles above the traces indicate time bins with significantly different activity between Interactive Mutual Gaze and Solo Gaze (p < 0.05, Wilcoxon rank sum, two-sided). (e) Proportions of significant cells out of all cells from each brain region that selectively differentiated Self-follow Mutual Gaze from Self Solo Gaze (mint), selectively differentiated Other-follow Mutual Gaze from Other Solo Gaze (purple), or differentiated both types of comparisons (blue). The black bars indicate the proportions of cells with greater activity for Interactive Mutual Gaze than Solo Gaze, whereas the gray bars indicate the opposite.
Would the activity of prefrontal and amygdala neurons display selectivity for Interactive Mutual Gaze compared to Solo Gaze? Do these cells exhibit agent-specific selectivity for mutual eye contact, that is, tracking who initiated or followed a mutual eye contact? To understand the neuronal bases of these interactive gaze behaviors, neural activity during Interactive Mutual Gaze events was contrasted to the corresponding Solo Gaze events (Fig. 5c, Fig.S6a–b; STAR Methods). In other words, each cell’s activity during Self-follow Mutual Gaze was compared to Self Solo Gaze (Fig. 5c, top, Fig. S6a) and activity during Other-follow Mutual Gaze was compared to Other Solo Gaze (Fig. 5c, bottom, Fig. S6b). Critically, these comparisons between Interactive Mutual Gaze and respective Solo Gaze were aligned to the gaze onset of the same individual (self or other) looking at the eyes of the other monkey and differed only in whether the other was already looking at this individual’s eyes (Interactive Mutual Gaze) or not (Solo Gaze) beforehand.
Many cells displayed mutual eye contact selectivity in all four brain regions. Some cells exclusively differentiated Self-follow Mutual Gaze from Self Solo Gaze (Fig. 5d, top), while others exclusively differentiated Other-follow Mutual Gaze from Other Solo Gaze (Fig. 5d, middle). Notably, in each of these four areas, comparable and relatively high proportions of cells – 18% and 17% of OFC (35% in total with agent-specific mutual eye contact selectivity), 13% and 16% of dmPFC (29%), 12% and 15% of ACCg (27%), 13% and 15% of BLA (28%) neurons – exclusively encoded Self-follow Mutual Gaze and Other-follow Mutual Gaze, respectively (Fig. 5e; all χ2 < 0.93, p > 0.33, Chi-square, FDR-corrected). By stark contrast, much smaller proportions of cells (4%, 6%, 4%, and 5%, respectively) signaled both types of mutual eye contact events (Fig. 5d, bottom, Fig. 5e; Self-follow vs. both types [Both]: χ2> 8.53, p < 0.005 for OFC, ACCg, and BLA, χ2 = 3.46, p = 0.06 for dmPFC; Other-follow vs. Both: all χ2 > 7.71, p < 0.01; FDR-corrected), supporting predominant neural representations of agent-specific mutual eye contact in the prefrontal-amygdala networks. Crucially, the majority of cells in these four areas showed higher activity for Interactive Mutual Gaze than Solo Gaze (Fig. 5e; χ2 > 5.14, p < 0.03 for 12 of 16 cases, FDR-corrected), suggesting a bias for signaling interactive mutual eye contact over non-mutual looking at the eyes. Although there were similar proportions of cells in the four regions that encoded Interactive Mutual Gaze compared to corresponding Solo Gaze, different regions exhibited distinct temporal profiles for Interactive Mutual Gaze events in terms of when the peak spiking activity occurred. These effects depended on the type of Interactive Mutual Gaze events (Self-follow or Other-follow) (Fig. S6c–d). Specifically, following the onset of Self-follow Mutual Gaze, OFC and BLA populations showed peak activity much later compared to dmPFC and ACCg populations (Fig. S6c; OFC vs. dmPFC: p < 0.005; OFC vs. ACCg: p = 0.01; BLA vs. dmPFC: p < 0.001; BLA vs. ACCg: p < 0.001; both p > 0.7 for the other two comparisons, Wilcoxon rank sum, two-sided). By contrast, following the onset of Other-follow Mutual Gaze, OFC, ACCg, and BLA populations showed peak activity much later compared dmPFC (Fig. S6d; OFC vs. dmPFC: p < 0.001; ACCg vs. dmPFC: p = 0.02; BLA vs. dmPFC: p < 0.0001; all p > 0.11 for the other comparisons, Wilcoxon rank sum, two-sided).
Overall, substantial proportions of neurons displayed selectivity not only for mutual eye contact compared to non-mutual looking at the eyes, but also for the agent-specific interactive context in which mutual eye contact happened. Thus, single-neuron activity in these regions appears to be well-suited for tracking agent-specific mutual eye contact, which is highly behaviorally relevant during social gaze interaction.
Partially overlapping neuronal ensembles recruited by social gaze interaction
We have shown widespread single-neuron implementations of three key signatures of social gaze interaction – social discriminability, social gaze monitoring, and mutual eye contact selectivity – in the prefrontal-amygdala networks (Fig. 6a). Finally, we asked if the three social gaze signatures were found in overlapping neuronal ensembles. Overlapping representations of these functions in the same populations of neurons would suggest a shared coding schema, whereas non-overlapping representations in distinct populations would support a functional specialization. A recent study showed that many cells in the macaque amygdala use a shared value-based coding schema for human intruder’s gaze direction (Pryluk et al., 2020) and for social rank (Munuera et al., 2018). By contrast, there is evidence from rodent work suggesting that distinct neuronal ensembles are recruited for social and non-social experience or even for different types of social processes (Allsop et al., 2018; Jennings et al., 2019; Kingsbury et al., 2020). Here, we specifically tested if the same groups of neurons encode social discriminability, social gaze monitoring, and mutual eye contact selectivity, and also if the answers to this question might differ by brain region.
Figure 6. Partially overlapping neuronal ensembles recruited by social gaze interaction.
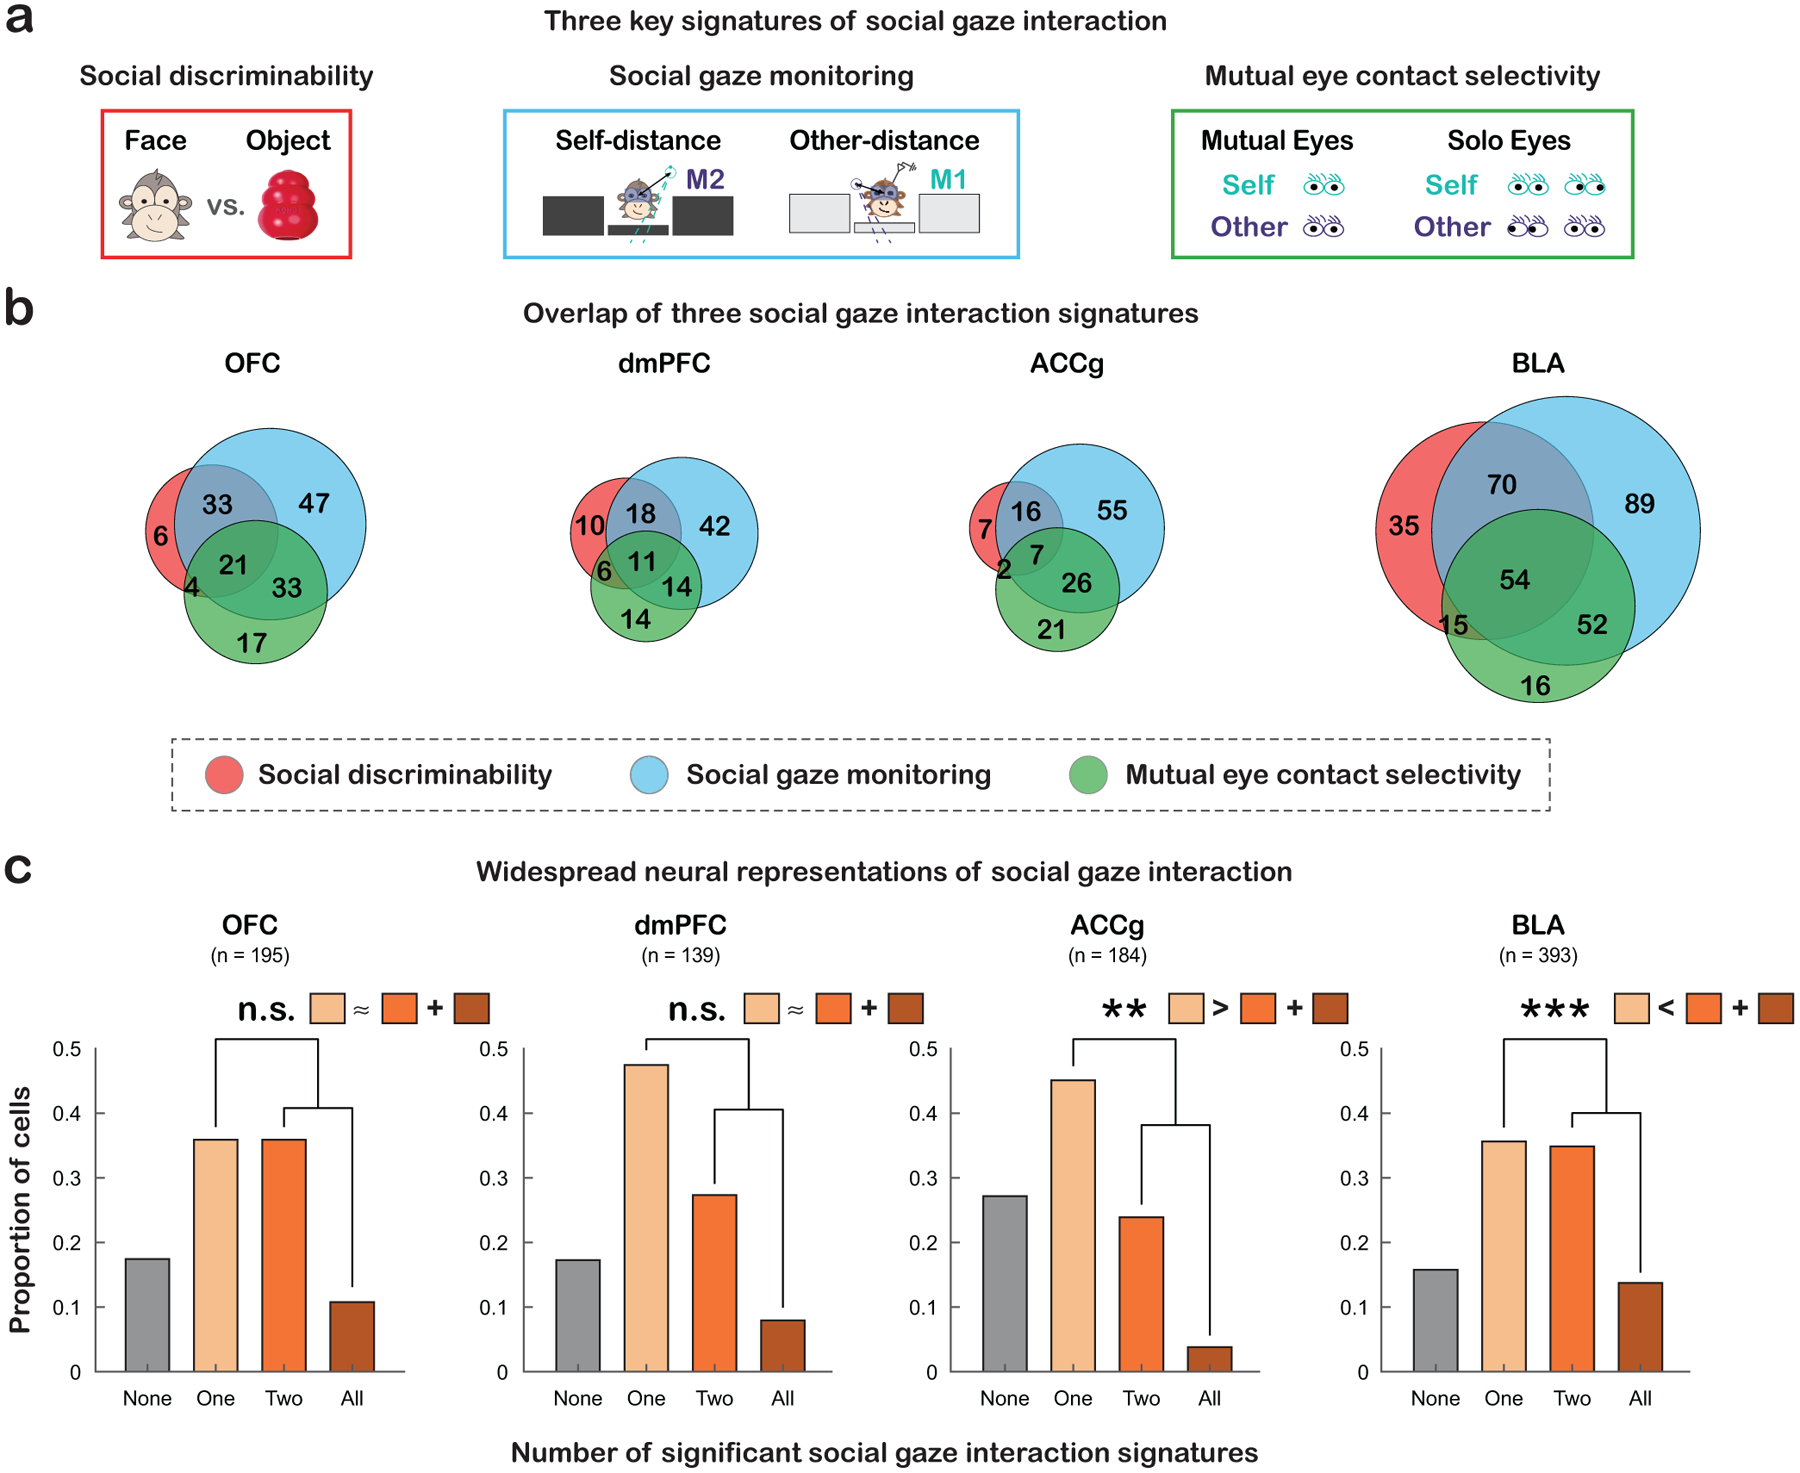
(a) Diagrams of the three signatures of social gaze interaction – social discriminability (red), social gaze monitoring (blue), and mutual eye contact selectivity (green). (b) Venn diagrams summarize the single-cell level overlaps among the three functions. See also Fig. S6.e–f. (c) Bar graphs show the proportions of cells involved in none (gray), one (light orange), two (orange), or all three (brown) of the social gaze interaction functions, with the insets representing the difference in the proportions of cells exhibiting just one versus multiple social gaze signatures. * p < 0.05, ** p < 0.01, *** p < 0.001, n.s., not significant, Chi-square, FDR-corrected.
While some neurons only signaled one specific signature of social gaze interaction, other cells signaled at least two of the three functions (Fig. 6b–c). There was a regional difference in the proportion of cells that displayed only one signature (Fig. 6c; χ2 = 9.66, p < 0.05, Chi-square, FDR-corrected), driven by greater proportion of such cells in dmPFC than BLA (χ2 = 6.09, p = 0.04). Moreover, the proportion of cells that displayed at least two signatures also differed across regions (χ2 = 26.79, p < 0.0001, FDR-corrected), driven by higher proportion of such cells in OFC than ACCg (χ2 = 14.51, p < 0.001, FDR-corrected) as well as higher proportion of such cells in BLA than dmPFC and ACCg (χ2 = 7.39 and χ2 = 22.44, p = 0.02 and p < 0.0001 respectively, FDR-corrected). Specifically, a greater proportion of BLA cells displayed multiple signatures compared to only one signature (χ2 = 13.05, p < 0.005, FDR-corrected), suggesting the presence of a shared coding schema for social gaze interaction in BLA. By contrast, more ACCg cells showed only one compared to multiple signatures (χ2 = 11.28, p < 0.005, FDR-corrected), suggesting a more functionally restricted representation of social gaze interaction in ACCg. Finally, comparable proportions of OFC and dmPFC cells showed only one and more than one signatures (χ2 = 4.23 and 3.80, p = 0.06 and 0.07 respectively, FDR-corrected). Notably, large proportions of cells with mutual eye contact selectivity were also involved in social gaze monitoring (Fig. S6e–f), both functions critical and relevant to social gaze exchanges. In conclusion, different aspects of social gaze interaction appear to recruit partially overlapping neuronal ensembles, where the degree of sharedness in functions depends on the brain region in the prefrontal-amygdala networks.
Discussion
We asked if and how neuronal populations in the primate prefrontal cortical areas and the amygdala signal three key signatures of real-life social gaze interaction – namely, social discriminability, social gaze monitoring, and mutual eye contact selectivity. Single-cell representations of these aspects of interactive social gaze were broadly found in partially overlapping populations not only in the amygdala (BLA) but also in the three prefrontal cortical regions examined (OFC, dmPFC, ACCg).
Intriguingly, the majority of neurons we examined in the prefrontal-amygdala networks only showed ‘social discriminability’ without further showing ‘face feature discriminability’. The neural differentiation of Face vs. Object was also much greater in these areas than the differentiation of Eyes vs. Non-eye Face. Population decoding of Face vs. Object was also consistently much better than Eyes vs. Non-eye Face. Therefore, while individual neurons in these areas might encode Eyes vs. Non-eye Face in a temporally heterogeneous manner, the discrimination of the two types of gaze fixation events was not robustly represented across distributed neuronal populations at any specific time, particularly in dmPFC, ACCg, and BLA. Neurons in the prefrontal-amygdala networks thus seem to prioritize categorical over feature-specific distinction in signaling gaze targets. This contrasts with the visual regions known to compute facial stimulus, such as face patches in the inferior temporal cortex, where the facial feature space is strongly represented (Freiwald et al., 2009). Therefore, during social gaze interaction, brain regions in the prefrontal-amygdala networks may represent higher dimensional information about an interacting social agent compared to visual areas.
Continuously monitoring the gaze of oneself and other is essential for social gaze interaction. To our knowledge, there is only one study so far that reported neural tracking of one’s own gaze positions relative to other’s eyes in the amygdala (Gilardeau et al., 2021). Critically, we additionally found such monitoring signals for one’s own gaze in the three prefrontal areas, which have not been reported before. This suggests that the amygdala is not unique for implementing such a function. More remarkably, in all four areas, we observed strong neural evidence of monitoring other’s gaze. Whether such distance variables are correlated with a specific cognitive process, such as engagement or momentary fluctuations in social state, or functionally related to the neuronal basis of social monitoring of other’s actions in dmPFC (Yoshida et al., 2012) remains to be examined.
Agent-specific representations of mutual eye contact by prefrontal and amygdalar neurons provide support for encoding the agency within an interactive context. Mutual eye contact selectivity was previously reported in amygdala neurons when monkeys interacted with a conspecific in videos (Mosher et al., 2014). More recently, using whole-brain functional neuroimaging, an elegant study by Shepherd and Freiwald (2018) reported specific involvements of dmPFC and ACCg when monkeys watched video clips of conspecifics with direct gaze (which resulted in mutual eye contact) compared to averted gaze (which resulted in non-mutual looking at the eyes). Here, we investigated the encoding of mutual eye contact in the prefrontal and amygdalar neural populations during naturalistic, face-to-face, social gaze interaction where gaze behaviors between individuals unfold over time in a behaviorally contingent manner. In addition to dmPFC and ACCg, we also found mutual eye contact selectivity in OFC and BLA neurons. Besides the differences in the neural sampling methodologies between our work and the work by Shepherd and Freiwald (2018), one intriguing explanation for the mutual eye contact selectivity in OFC and BLA neurons, in addition to dmPFC and ACCg in our work, could be related to the notion that some regions might be more strongly recruited during behaviorally contingent social exchanges involving two or more interacting agents that unfold over time in the context of uncertainty. Indeed, evidence indicates that neural encoding of social variables is sensitive to the communicative context in naturalistic settings (Nummela et al., 2017; Jovanovic et al., 2022). Further, we observed that selectivity for mutual eye contact in dmPFC and ACCg cells emerged earlier compared to OFC and BLA cells at the population level, especially for mutual eye contact initiated by others and followed by oneself, suggesting that these medial prefrontal regions might be essential for social interest in monitoring and looking at others that may serve as a gateway to many different types of social behaviors (Basile et al., 2020; Rudebeck et al., 2006).
Our findings support that the neuronal bases of mutual eye contact selectivity, or more broadly interactive social gaze, span multiple brain regions in the prefrontal-amygdala networks. We purposefully analyzed the time period starting from the onset of mutual eye contact events where we could best match the gaze behaviors between interactive events and non-interactive events. Thus, our analyses were mostly focused on examining the outcome-related processes underlying mutual eye contact. Future research could investigate how neurons in the prefrontal-amygdala networks predict other’s social gaze behaviors that may ultimately result in a mutual eye contact, similar to how neurons in the medial prefrontal cortex (Haroush and Williams, 2015) and the amygdala (Grabenhorst et al., 2019) predictively signal partner’s choice behaviors. Such predictive coding may depend on the social relationships between the dyads as in the case of social gaze dynamics (Dal Monte et al., 2016).
Researchers have extensively studied the neural bases of social perception. Major neural systems involved in social perception are distributed across the temporal and visual cortical areas (Haxby et al., 2000), including the hierarchically modular face patches in the inferior temporal cortex (Freiwald and Tsao, 2010; Koyano et al., 2021; Leopold et al., 2006; McMahon et al., 2015; Tsao et al., 2006), a prefrontal face patch in OFC (Barat et al., 2018; Rolls et al., 2006; Tsao et al., 2008), and the human fusiform gyrus (Kanwisher et al., 1997; McCarthy et al., 1997). Neurons in the primate amygdala have also been shown to signal facial expression categories and mutual eye gaze depicted in images (Gilardeau et al., 2021; Gothard et al., 2007; Livneh et al., 2012; Mosher et al., 2014; Rutishauser et al., 2011; Wang et al., 2017), both of which are intricately linked to interacting with others. How might the primate brain represent and enable social interaction? Some important studies started to shed light on this topic. A recent study discovered a gaze-following patch in the superior temporal sulcus that might mediate a transition from perception to action (Marciniak et al., 2014; Ramezanpour and Thier, 2020). Notably, functional neuroimaging work in macaques has found specific brain activations for observing the interactive aspects of social behaviors among conspecifics that widely span across multiple brain areas in the primate social interaction networks (Shepherd and Freiwald, 2018; Sliwa and Freiwald, 2017). Our results add new knowledge to the literature by investigating spiking activity in a subset of prefrontal and amygdalar regions, belonging to the primate social interaction networks, while monkeys were engaged in real-life social interactions.
Our findings are consistent with the notion that amygdala’s function in signaling biological importance is shaped by neural representations of its interconnected prefrontal areas, such as OFC, dmPFC, and ACCg (Murray and Fellows, 2021). The presence of widespread interactive social gaze neurons in the prefrontal areas that are reciprocally connected with BLA supports such interdependencies that may provide one explanation as to why a specific set of brain areas belonging to the ‘social brain’ are consistently recruited by multitudes of social functions. A fruitful direction for future research is to better understand how functional specificities underlying certain social behaviors may arise through dynamic communications among two or more brain structures. Although there are many similarities in how OFC, dmPFC, and ACCg neurons signal social gaze interaction, how each of these neural populations interacts with BLA is likely to be more constrained under specific social contexts.
It is worth noting that investigating social behaviors in a naturalistic setting presents advantages and disadvantages. By not imposing any task structure, we were able to study spontaneously occurring social gaze behaviors in non-human primates. While the social gaze interactions studied here were naturalistic and relied upon social decisions to engage with another social agent, having no task structure blurred the boundary between social attention and social decision to look at the conspecific. Because we were interested in spontaneous social interactions, our analyses were focused on the types of behaviors with sufficient and comparable numbers of repetitions. Furthermore, as we did not record neural activity from the same neurons when monkeys interacted with different partners, we were unable to examine if and how these neurons encode the identity of partner monkeys (Landi et al., 2021; Baez-Mendoza et al., 2021). It would be informative for future studies to examine identity selectivity in interactive social gaze neurons during naturalistic social gaze interaction. We also did not monitor facial expressions that might be associated with various social gaze fixation events. Thus, it remains unclear if these neurons in the prefrontal-amygdala networks recruited during interactive social gaze behaviors modulate their activity by social contexts conveyed by facial expressions. Nevertheless, by applying a naturalistic, real-life social gaze interaction paradigm, the current investigation provides an example of choosing an appropriate balance between ecological validity and experimental control (Fan et al., 2021).
Overall, our findings support the view that the neural underpinnings of social gaze interaction are widespread in multiple brain regions in the prefrontal-amygdala networks. Single-neuron implementations of key signatures of social gaze interaction in OFC, dmPFC, ACCg, and BLA were robust and frequently found in high proportions. These extensive representations of social gaze signatures are likely indicative of the evolutionary pressure put on the primate brain for engaging in complex social interactions. The highly distributed nature of social gaze variables also emphasizes network-level interactions in the prefrontal-amygdala pathways in guiding social interaction, instead of modular stages where a specific aspect of social gaze is computed in one specific neural population. Testing the causal contributions of these areas in the prefrontal-amygdala networks will help elucidate when and how these neural populations are regulating social gaze interaction. It will also provide opportunities to determine if these widespread neural signals reflect simple anatomical connections with a smaller subset of brain regions performing causal computations or signify evolutionarily built-in resilience that are central to social behaviors with utmost ethological value in primate species.
STAR Methods
RESOURCE AVAILABILITY
Lead contact
Further information and requests for resources and reagents should be directed to and will be fulfilled by the lead contact, Steve W. C. Chang (steve.chang@yale.edu).
Material availability
This study did not generate new unique reagents.
Data and code availability
Behavioral and neural data presented in this paper will be available upon request from the lead contact. Original codes can be found at https://github.com/changlabneuro/pfc_amyg_socialgaze.
EXPERIMENTAL MODEL AND SUBJECT DETAILS
Animals
Two adult male rhesus macaques (Macaca mulatta) were involved as recorded monkeys (M1; monkeys L and K; aged 8 and 7 years, weighing 15.7 kg and 10 kg, respectively). A few animals served as partner monkeys (M2). Over the course of the experiments using M1-M2 pairings, Monkey L interacted with two adult male M2s and one adult female M2 (monkeys C, H, and E, all aged between 7 and 8 years, weighing 10.1kg, 11.1kg, and 10.7kg, respectively). Monkey K also interacted with two male M2s and one female M2 (monkeys L, H, and E). These resulted in in six distinct macaque pairs for our behavioral and neuronal data (monkeys L-C, L-H, L-E, K-L, K-H, K-E). The recorded and partner monkeys were unrelated and were housed in the same colony room with other macaques. Within the same-sex pairs, monkey L was dominant over monkey C but subordinate to monkey H, whereas monkey K was dominant over monkey L but subordinate to monkey H. The current data collection was focused on investigating single-cell activity during spontaneous, face-to-face social gaze interaction and did not have the necessary number of pairs to examine the modulatory effects of social relationship, such as social rank. Nevertheless, our previously published work (Dal Monte et al., 2016) using the identical paradigm provides a comprehensive examination of social relationship effects on social gaze interaction from unique 8 dominance-related, 20 familiarity-related, and 20 sex-related perspectives. In this study, all animals were kept on a 12-hr light/dark cycle with unrestricted access to food, but controlled access to fluid during testing. All procedures were approved by the Yale Institutional Animal Care and Use Committee and in compliance with the National Institutes of Health Guide for the Care and Use of Laboratory Animals. No animals were excluded from our analyses.
METHOD DETAILS
Experimental setup
On each day, M1 and M2 sat in primate chairs (Precision Engineering, Inc.) facing each other, 100 cm apart with the top of each monkey’s head 75 cm from the floor (Fig 1a, Fig. S1a–b). Each monkey faced three monitors with the middle monitor 36 cm away from the eyes. Two infrared eye-tracking cameras (EyeLink 1000, SR Research) continuously and simultaneously recorded the horizontal and vertical eye positions of both monkeys.
Each monkey first underwent a standard eye position calibration procedure. The middle monitor displayed five stimuli in different locations, controlled by Psychtoolbox (Brainard, 1997) and EyeLink toolbox (Cornelissen et al., 2002) in MATLAB. Each monkey was required to fixate on these stimuli sequentially to calibrate and register eye positions. During this procedure, neither monkey had visual access to the other. Critically, because each animal’s face was on a different depth plane from the monitors, we carried out an additional calibration procedure to precisely map out each monkey’s facial regions. To do so, we designed a customized face calibration board (23 cm L×18 cm H×1.5 cm W) embedded with LED lights that were aligned to each monkey’s eyes, mouth, and the four corners of the face (Fig. S1c–e). This custom board was first positioned in front of a monkey’s face, secured on the primate chair, and then the middle monitors were lowered down remotely using a controlled hydraulic system. The monkey undergoing this calibration was required to fixate on these LED lights in sequence to register eye positions, after which the middle monitors were raised up to block the view of the two monkeys. The same procedure was immediately repeated for the second monkey. The middle monitors then remained raised up until the beginning of recording sessions.
Each recording day consisted of a total of 10 social gaze interaction blocks from a specific pair of monkeys. At the beginning of each session, the middle monitors were lowered down remotely so that the two monkeys could fully see each other (Fig 1a, Fig. S1a–b). During each session, monkeys could freely make spontaneous eye movements and interact with each other using gaze for five minutes. At the end of each 5-min session, the middle monitors were raised up remotely, and monkeys had no visual access of one another during a 3-min break (inter-session breaks). On M1’s side, two identical objects (chosen from monkey toy cones, toy keys, or bananas, on different days) were attached to the monitors at 20.7° eccentricity throughout the sessions to serve as non-social objects (Fig 1a).
Gaze regions of interest
We identified four gaze regions of interest (ROIs): Face, Eyes, Non-eye Face (i.e., face excluding the eye regions), and Object (Fig 1b). From each day’s calibration, the Face ROI was defined by the four corners of a monkey’s face, and the Eyes ROI was defined by adding a padding of to the center of each eye. The Object ROI had the same surface area as the Face ROI, unless when it was directly compared to Eyes ROI where we matched its surface area to that of Eyes ROI (Fig. 1b). This was applied in all neural analyses when we compared activity for looking at different ROIs to control for potential effect related to having different visual ROI surface areas on neural activity. Fixations were identified using EyeMMV toolbox (Krassanakis et al., 2014) implemented in MATLAB. We detected fixations based on spatial and duration parameters. Specifically, we used t1 = 1.18 and t2 = 0.59 degrees of visual angle for the spatial tolerances, and a minimum duration of 70 msec. As this fixation detection procedure does not incorporate velocity, eye movement speed was not considered when identifying fixations. For the three non-overlapping ROIs, Eyes, Non-eye Face, and Object, we calculated the total number of M1’s gaze fixations and average duration per fixation for each day. One-way ANOVA was used to compare each variable across the three ROIs (Fig 1c).
Social gaze event transition probability
To better capture the dynamics of monkeys’ social gaze behaviors, we computed social gaze fixation event transition probability and frequency of each of the nine possible transitions between pairs of current and next fixations to Eye, Non-eye face, and Object ROIs for each day separately. For example, for each current gaze fixation to Eyes, we considered whether the next gaze fixation event was Eyes, Non-eye Face, or Object. We calculated the frequency of each type of these transitions for each day and computed the transition probability by dividing such frequency by the total number of current gaze fixations to Eyes for each day separately. We applied the same procedure for current fixations to Non-eye Face and Object and therefore obtained the average transition probabilities across days for each of the nine possible social gaze fixation event transitions (Fig. 1d).
Saccade kinematics
We also examined saccade kinematics for all saccades landing in the Eyes, Non-eye Face, or Object ROIs separately. To identify the start and end of a saccade, we first smoothed the raw eye position data with a moving average filter, with a window size of 0.5% of the length of the position data. We then computed the velocity gradient of the smoothed position data. Saccade onset was identified by locating the first time point at which the X or Y speed exceeded 50 deg/sec, and saccade offset was identified as the earliest subsequent time point at which the X or Y speed dropped below the 50 deg/sec speed threshold. We rejected saccades detected in this fashion that were shorter than 50 msec. For each saccade, we computed its amplitude as the distance between its start and end points and calculated its peak velocity as the maximum velocity over the saccade interval. We then plotted peak velocity over amplitude for all saccades landing in each of the three ROIs (Fig. 1e). To compare the peak velocity-amplitude profiles across the three ROIs, we clustered peak velocity and amplitude samples across these ROIs using k-means clustering with k = 3. Within each cluster, we computed the ratio of peak velocity to amplitude separately for each ROI. Lastly, we compared such ratios for each ROI across clusters using one-way ANOVA.
Surgery and anatomical localization
All animals received a surgically implanted headpost (Grey Matter Research) for restraining their head movement. A second surgery was performed on the two recorded animals to implant a recording chamber (Crist and Rogue Research Inc.) to permit neural recordings from OFC (Brodmann areas 11 and 13m), dmPFC (8Bm and F6), ACCg (24a, 24b and 32), and BLA (Paxinos et al., 1999). See Fig. 1f for the summary of electrode locations on representative MR slices, and Fig. 1g for the locations of individual cells on the Paxinos slices). Placement of the chambers was guided by both structural magnetic resonance imaging (MRI, 3T Siemens) scans and stereotaxic coordinates.
Single-unit activity
Single-unit activity was recorded from 16-channel axial array electrodes (U- or V-Probes, Plexon Inc.) using a 64-channel system (Plexon Inc.) (Fig. 1f). A guide tube was used to penetrate intact dura and to guide electrodes, which were remotely lowered by using a motorized multi-electrode microdrive system (NaN Instruments) at the speed of 0.02 mm/sec. After electrodes reached targeted sites, we waited 30 min for the tissue to settle and to ensure signal stability before starting neural recording.
Broadband analog signals were amplified, band-pass filtered (250 Hz–8 kHz), and digitized (40 kHz) using a Plexon OmniPlex system. Spiking data were saved for waveform verifications offline and automatically sorted using the MountainSort algorithm (Chung et al., 2017). This resulted in a total of 241 OFC, 187 dmPFC, 236 ACCg, and 537 BLA units from two recorded monkeys (monkey L and monkey K: 102 and 139 OFC cells, 92 and 95 dmPFC cells, 109 and 127 ACCg cells, and 225 and 312 BLA cells, respectively). Peri-stimulus time histogram (PSTH) of each cell was constructed by binning spike train with 10-msec time bins and smoothing the average firing rate with 100-msec sliding windows in 10-msec steps (Fig. 2a).
QUANTIFICATION AND STATISTICAL ANALYSIS
Hierarchical classification of ROI selectivity
For each neuron, we calculated its average firing rate during the pre-gaze epoch (500 msec leading up to the time of gaze fixation onset) and post-gaze epoch (500 msec following the time of gaze fixation onset) and applied hierarchical ANOVA for classification (Fig. 2b). For each region, we first calculated the percentage of cells with ‘social discriminability’ whose activity significantly discriminated Face from Object in either time epoch (p < 0.05). Among these significant cells, we further calculated the percentage of cells with ‘face feature discriminability’ whose activity discriminated Eyes from Non-eye Face in either time epoch (p < 0.05). For this and further analyses where Object was involved in any certain pairwise comparisons, we used a subset of neurons collected from the days when non-social objects were included in the experiment (30 out of 42 days), resulting in 195 OFC, 139 dmPFC, 184 ACCg, and 393 BLA neurons from the two recorded monkeys (monkey L and monkey K: 102 and 93 OFC cells, 92 and 47 dmPFC cells, 109 and 75 ACCg cells, and 225 and 168 BLA cells, respectively). To examine neural activity at the population level, the total number of spikes occurring during the post-gaze epoch when looking at Eyes, Face, and Object was averaged and then z-scored across all neurons and ROIs for each region (Fig. S2a). We then compared average z-scored spike count across ROIs and brain regions using two-way ANOVA.
Spatial location control
This control analysis assessed whether neurons’ distinct activity for looking at Face and Object was due to different spatial locations of the two stimuli. Because in our setup, Face and Object were always in different locations, we tested neurons’ spatial selectivity by controlling for current fixation location with different previous fixation location. We defined a 9-cell (3 × 3) space grid aligned to M2’s face, where the center grid cell was defined as the Face ROI with the remaining cells distributed around it (Fig. 2c, top left). Each grid cell was numbered, where the Face ROI was associated with grid index 5. We first examined the 500-msec period preceding each current looking event to Face, identified the fixation right before the Face event, and assigned this fixation to one of the 9 spatial grid cells according to its average position. If the location of this preceding fixation fell either outside the grid or within the Face ROI, the corresponding current Face event was excluded from this analysis. We then averaged the spike counts of each neuron over the pre-gaze epoch and post-gaze epoch separately. For each time epoch and neuron, we then ran one-way ANOVA with grid index as the factor. For neurons with a significant main effect of grid index (p < 0.05), we computed, for each grid index, the proportion of significant Tukey post-hoc comparisons between that grid index and all the others (p < 0.05). For neurons with no main effect of grid index, we set these proportions to 0. We then averaged these proportions across neurons to produce a heatmap (Fig. 2c, top right). Lastly, for each brain region and time epoch, we plotted a Venn diagram to examine the overlap between neurons that significantly differentiated looking at Face vs. Object based on the hierarchical ANOVA (see above) and neurons that significantly differentiated space grids (Fig. 2c, bottom). A small overlap would mean that the distinct activity for Face vs. Object was mainly due to the differentiation of social vs. non-social stimuli and unlikely due to their different spatial locations, because the majority of neurons with social discriminability didn’t show spatial selectivity.
Central fixation control
This control analysis tested whether neural activity would vary depending on the type of stimuli even when they were positioned in the same location. We compared neural activity between when M1 fixated on M2’s Face and when M1 fixated on a white central Fixation square (Fig. 2d, left) shown on the middle screen (when the middle screen was raised up during inter-session breaks). We used a subset of neurons from days when we presented the Fixation square stimuli during the inter-session breaks (178 OFC, 132 dmPFC, 172 ACCg, and 393 BLA cells in total). For each cell, we computed average spike counts over the 500-msec period after the presentation of the central Fixation square on trials where M1 successfully fixated on the square for 300 msec. We then performed a Wilcoxon rank sum test (p < 0.05, two-sided) to compare this spike distribution to average spike counts over the 500-msec period following looking at M2’s Face to examine the percentage of cells per brain region that showed distinct activity for Face vs. Fixation square (Fig. 2d, top right), both in the central fixation location of M1’s view. Lastly, for each brain region, we plotted a Venn diagram to evaluate the overlap between neurons that significantly differentiated Face vs. Object based on hierarchical ANOVA (see above) and neurons that significantly differentiated Face vs. Fixation square (Fig. 2d, bottom right). A large overlap would mean that activity associated with social discriminability was unlikely driven by the different visual angle between looking at Face and Object, as many of these cells also showed distinct activity for Face and Fixation square, both requiring a central gaze fixation.
Receiver operating characteristic analysis
For each brain area, we compared each neuron’s firing rate distribution for pairs of ROIs, including Face vs. Object (with a matching ROI size; Fig. 3a), Eyes vs. Object (with a matching ROI size; Fig. S2b), and Eyes vs. Non-eye Face (Fig. 3b) to perform the receiver operating characteristic (ROC) analysis. For each pairwise comparison, we binned spiking activity in consecutive 10-msec time bins, ranging from 500 msec before to 500 msec after M1’s corresponding gaze fixation event onset. For each neuron, we then determined if each time bin had a significant area under the curve (AUC) value by shuffling its firing rates and ROI labels 100 times (p < 0.01, permutation test). Neurons with significant AUC values for at least 5 consecutive bins were included in further analyses and were sorted based on the first bin with a significant AUC value.
For each pair of ROIs and brain region, we compared the proportion of cells that began discriminating the two ROIs during the pre-gaze epoch (“pre”) vs. during post-gaze epoch (“post”). A cell was assigned to the “pre” category if the first time point of at least five consecutive bins from the AUC sequence fell within the pre-gaze epoch, whereas a cell was assigned to the “post” category otherwise. For each ROI pair and brain area, we performed a Chi-square test to compare the relative proportions of “pre” vs. “post” cells.
Similarly, we compared the proportions of cells that fired more for the first ROI in a pair than the second ROI (AUC > 0.5, “greater”; red bar to the right of each heatmap in Fig. 3a–b and Fig. S2b) to the proportions of cells that fired more for the second ROI than the first ROI (AUC < 0.5, “less”; blue bar) using a Chi-square test. A cell was assigned to the “greater” category if the first time point of at least five consecutive bins from AUC sequence had greater activity for the first ROI, whereas a cell was assigned to the “less” category if that first time point had greater activity for the second ROI.
Time-to-peak analysis
To further investigate the temporal profiles of our data, we examined the time points at which each cell showed peak spiking activity and compared if the peak spiking activity occurred at different times for looking at Face vs. Object (Fig. S3a), Eyes vs. Object (Fig. S3b), and Eyes vs. Non-eye Face (Fig. S3c) in each brain region separately. To do so, we first computed spike counts in 50-msec sliding windows, in 10-msec steps, from 500 msec before to 500 msec after the onset of M1’s gaze fixation events. We restricted this analysis to a set of events separated by at least 1-sec period to avoid potential confounds from any type of temporally adjacent gaze fixation events on neural activity – for instance, for a given Face event, there were no other ROI-defined events of any type for at least 1 sec. For each neuron and ROI, we averaged the distribution of spike counts over gaze fixation events and detected the time point at which this average was maximal. We then calculated the cumulative proportions of cells with peak spiking activity along the 1-sec period centered on the onset of each type of gaze fixation events and compared the distributions between pairs of ROIs separately for each region using Wilcoxon rank sum test and compare the distributions for each ROI across brain regions using ANOVA.
Spike latency analysis
In addition to the receiver operating characteristic analysis and time-to-peak analyses, we further computed spike latency separately for each ROI and cell, defined as the earliest time point between 500 msec before and 500 msec after the onset of M1’s gaze fixation events at which the mean firing rate of the cell was more than 4 standard errors different from the mean baseline activity, either higher or lower (Fig. S3d–f). The baseline means were established separately for each cell by calculating the mean firing rate across all fixations and averaged across the same 1-sec time window. For each region, we computed the cumulative proportions of cell with spike latency along the 1-sec period centered on the onset of each type of gaze fixation events, excluding cells with comparable activity as the baseline throughout the whole time period. We compared the distributions of latency between pairs of ROIs separately for each region using Wilcoxon rank sum test and compare the distributions for each ROI across brain regions using ANOVA.
Decoding analysis
For each brain region, we trained a max-correlation-coefficient (MCC) pattern classifier (Meyers, 2013; Meyers et al., 2015; Meyers et al., 2018) on neurons’ (pseudo-population) firing rates (Munuera et al., 2018) to discriminate between pairs of gaze fixation events, including Face vs. Object with a matching ROI size (Fig. 3c), Eyes vs. Object with a matching ROI size (Fig. S2c), and Eyes vs. Non-eye Face (Fig. 3d). First, neurons were selected from the pool of all available neurons. Neurons that had fewer than 15 trials of a certain type of gaze fixation events were excluded in the corresponding pairwise decoding analysis, which resulted in 195 OFC, 139 dmPFC, 184 ACCg, and 380 BLA cells in total for Face vs. Object; 89 OFC, 110 dmPFC, 125 ACCg, and 264 BLA cells for Eyes vs. Object; and 241 OFC, 187 dmPFC, 236 ACCg, and 537 BLA cells for Eyes vs. Non-eye Face. For each neuron, we then randomly selected firing rates from 15 trials of each type of gaze fixation events involved in the pair-wise decoding. A cross-validation procedure was repeated 15 times. In each repetition, 14 data points from each of the two classes were used as training data and one data point from each class was used for testing the classifier. Specifically, prior to training and testing the classifier, a normalization step was applied by subtracting the mean activity and dividing by standard deviation during the 2 sec around the onset of gaze fixation events for each neuron. This z-score normalization helped ensure that the decoding algorithm could be influenced by all neurons rather than only by those with high firing rates. The steps described above were repeated 100 times to give a smoothed bootstrap-like estimate of the classification accuracy. The classification accuracy is the average over all the bootstrap and cross-validation trials. This procedure was run once to get the true distribution. For the null distribution, it was repeated 1000 times with randomly shuffled ROI labels. A time bin was marked significant when the true decoding accuracy exceeded all the values in the null distribution (p < 0.001).
For each pairwise decoding, we calculated the mean classification accuracy for each epoch and region for each iteration to compare the decoding accuracy across time epochs and brain regions. We first compared the classification accuracy during pre-gaze epoch to post-gaze epoch across 100 iterations for each brain region (Wilcoxon sign rank, two-sided). We next compared the classification accuracy between any pair of brain regions across 100 iterations for each time epoch (Wilcoxon rank sum, two-sided). P-values from these two tests were FDR-corrected for each pairwise decoding separately. Finally, to control for any effect of the number of cells on decoding performance, we additionally ran the decoding analysis with the same number of neurons across regions by sub-sampling on each iteration for both the true and null models (across four brain regions: 139 cells for Face vs. Object, 89 cells for Eyes vs. Object, and 187 cells for Eyes vs. Non-eye Face) and observed similar results (Fig. S2d). These numbers were chosen based on the lowest number of available cells among the four regions.
Spike-density maps for different ROIs
To examine spike modulations with respect to the surrounding space of different ROIs, a spatial grid spanning 40 degrees of visual angle in both horizontal and vertical dimensions was constructed, centered on the Eyes, Face, and Object ROIs, separately, with 100 bins in each dimension. Each M1’s fixation was assigned to a grid-square based on the centroid of that fixation. For each neuron, the total number of spikes occurring within the 500 msec after each fixation onset was calculated and assigned to the corresponding grid-square. Total spike counts were calculated by summing across all fixations in each grid-square for each neuron and were z-scored and averaged across neurons (Fig. 4a, Fig. S4).
Social gaze monitoring modeling analyses
To test if and how neural activity tracks the gaze fixation of self or other, we constructed a stepwise general linear model (GLM) for each cell. This model quantified each neuron’s firing rate in relation to two social gaze-related distance variables – 1) Self-distance (M1dis), the distance between recorded monkey’s gaze position and the center of partner monkey’s eyes projected onto the same plane, and 2) Other-distance (M2dis), the distance between partner monkey’s gaze position and the center of recorded monkey’s eyes projected onto the same plane (Eq. 1) (Fig. 4b). We used stepwiseglm function in MATLAB to fit the model with a log link function. By expressing log (firing rate) as , we obtained the fixation duration final equation used to fit the model (Eq. 2) with the assumption that spike count follows a Poisson distribution, and set log (fixation duration) as an offset for each fixation.
| (Eq. 1) |
| (Eq. 2) |
To fit the model, we first identified all of M1’s fixations in space regardless of where M2 was looking at. For each M1’s fixation, we then examined the gaze positions of M2 at 1 Hz resolution. A fixation was dropped if more than 90% of M2’s gaze samples were outside 1 degree of visual angle from the centroid of these samples during the period of that M1’s fixation. This procedure was to exclude M2’s saccades and therefore to ensure that the calculation of mean gaze positions was precise. We further excluded any M1’s fixation if its mean gaze position was outside 20 visual degree radius from the center of M2’s Eyes to reasonably ensure that M1 was able to monitor where M2 was looking at using his peripheral vision. We used 20 visual degrees based on macaque’s ability to make peripheral visual discrimination at this eccentricity in controlled visual behavioral tasks (McAlonan et al., 2008). We applied the same 20 visual degree criterion for M2’s fixations so that it would be fair to compare the coefficient across Self-distance and Other-distance. On average, about a few hundreds of fixations were used to fit the model per neuron (mean = 650, median = 518). For each of these fixations, we calculated its duration, the total number of spikes during that duration, as well as Self-distance and Other-distance. For each neuron, stepwise GLM first tested each variable and selected the one that significantly explained the neural data most. It then tested if adding a second variable would significantly improve the model performance until adding a new variable no longer improved the model. Advantages of this method are that it does not depend on the order of variable inputs and does not force a neuron to include both variables.
We plotted single-cell PSTHs by four categories of distance of Self-distance and Other-distance (0–5, 5–10, 10–15, and 15–20 visual degree) and showed both decreasing and increasing modulations (Fig. 4c). To better visualize the neural modulation by the distance variables, scatter plots showed the mean activity for each category of distance during the 250 msec after the onset of gaze fixations, that was about the average fixation duration per day (mean = 248 msec and median = 247 msec). At the population level, we calculated the proportion of neurons whose spiking activity was significantly explained by Self-distance and Other-distance (Fig. 4d; p < 0.05) and compared these proportions within region and across regions using Chi-square test with FDR correction. For neurons that significantly tracked either Self-distance or Other-distance, we examined the distribution of the coefficient of these terms by testing if the median coefficient was significantly different from zero for each brain region (Fig. 4e; Wilcoxon sign rank test, two-sided). Lastly, to inspect the quality of model fits, we generated a null distribution of mean and median adjusted R2 by shuffling each pair of Self-distance and Other-distance across fixations for 100 times for each neuron. For example, for each neuron, we have {spike count 1, spike count 2, spike count 3…, spike count n}, {duration 1, duration 2, duration 3…, duration n}, {self-distance 1, self-distance 2, self-distance 3…, self-distance n} and {other-distance 1, other-distance 2, other-distance 3…, other-distance n} for n fixations. We shuffled pairs of self-distance and other-distance, such that an example iteration of shuffling could result in {self-distance 1, self-distance 4, self-distance 2, …} and {other-distance 1, other-distance 4, other-distance 2, …}. And we fit the model again using the same spike count and duration data as in the original data, but the new shuffled Self-distance and Other-distance and repeated this procedure 100 times for each neuron. At the population level, we calculated the mean and median of adjusted R2 across all neurons in each region for each of these iterations, and compared this null distribution of 100 means and medians to the true mean and median of adjusted R2 (Fig. S5a, permutation test).
To further check that our modeling results were not driven by potential correlated Self-distance and Other-distance from any specific day, we applied the same analyses only using cells from days where binned Self-distance and Other-distance were uncorrelated. As there were hundreds of fixations used in the model for each neuron, to more accurately portray the relationship between Self-distance and Other-distance, we looked at the correlation using binned data. To do that, we first divided M1’s fixations from a certain day into 10 groups based on Self-distance (0–2, 2–4, … 18–20 visual degrees) and calculated the median Self-distance and Other-distance for each group. We plotted these binned Self-distance and Other-distance values across all days (Fig. S5b) and calculated the Spearman correlation between the two variables using the binned data for each day individually. The median correlation across all days was 0.48, and two-thirds of the days (28 out of 42 days) had uncorrelated binned Self-distance and Other-distance (Fig. S5c; p >= 0.05). We applied the same set of analyses shown above only using neurons from these uncorrelated days and observed similar results (Fig. S5d–f).
Mutual eye contact selectivity analyses
To examine the interactive aspects of social gaze, we focused on Interactive Mutual Gaze events defined as when both monkeys looked at each other’s Eyes simultaneously, as a function of context – that is, agent-specific sequence leading to a mutual eye contact. This resulted in two types of Mutual Gaze events, Self-follow Mutual Gaze and Other-follow Mutual Gaze. We compared Mutual Gaze events to non-interactive Solo Gaze events, which were defined as when only one monkey in the pair looked at the other’s eyes without any reciprocating gaze from the other monkey within at least 2-sec period around that event. To correct the discontinuity of an event when monkeys abruptly broke fixation, we smoothed the gaze vector by filling gaps between fixations less than 30 msec apart. Additionally, we excluded Mutual Gaze events shorter than 50 msec. Behaviorally, we calculated the proportion of Self-follow and Other-follow Mutual Gaze events for each day (Fig. 5b, left), the average duration of Mutual Gaze and Solo Gaze in general (Fig. 5b, middle), as well as behavioral latency (Fig. 5b, right), measured as the time for the follower monkey to look at the eyes of the other monkey who initiated the mutual eye contact.
To test if and how neurons discriminated Mutual Gaze from Solo Gaze events, for each neuron, we compared spiking activity associated with Self-follow Mutual Gaze to Self Solo Gaze aligned to the time of M1 looking at M2’s eyes, as well as activity associated with Other-follow Mutual Gaze to Other Solo Gaze aligned to the time of M2 looking at M1’s eyes (Fig. 5c, Fig. S6a–b), using two-sided Wilcoxon rank sum tests in 10-msec time bins. This approach ensured that across the two conditions compared, the same individual was looking at the eyes of the other monkey on and after time zero. Therefore, the only difference was if the other monkey was already looking at this individual’s eyes (Interactive Mutual Gaze) or not (Solo Gaze) beforehand. Further, to reasonably ensure that the recorded monkey was able to see in the periphery where the partner monkey was looking at, we selected gaze fixation events when M1’s gaze positions were within 20 visual degree radius from the center of M2’s Eyes ROI at least once during the time when M2 looked at M1 (noted as ‘M1 gaze criterion’ in Fig. S6a–b). For example, for Self-follow Mutual Gaze, we analyzed events when M1’s gaze positions were within 20 visual degrees at any time point during the time when M2 was looking at M1’s eyes prior to time zero when M1 shifted gaze to look at M2’s eyes (Fig. S6a). Similarly, for Other Solo Gaze, we analyzed events when M1’s gaze positions were within 20 visual degrees at any time point after time zero during Other Solo Gaze events (Fig. S6b).
At the population level, we calculated the proportion of cells per brain region that showed distinct activity for 1) Self-follow Mutual Gaze vs. Self Solo Gaze selectively (Self-follow), 2) Other-follow Mutual Gaze vs. Other Solo Gaze selectively (Other-follow), or 3) both comparisons (Both) for at least 5 consecutive bins during the 500 msec after event onset (Fig. 5e). For each brain region, we compared the proportions of significant cells with selectivity for Self-follow, Other-follow, and Both by using pair-wise Chi-square test (FDR-corrected). Lastly, for each combination of context and brain region, we compared the proportion of significant cells that fired more for Mutual Gaze to those that fired more for corresponding Solo Gaze.
To further examine the temporal profiles of neurons in the four regions for Interactive Mutual Gaze events, we examined the time points when neurons exhibited peak spiking activity for Self-follow and Other-follow Mutual Gaze events separately. We first computed spike counts in 10-msec sliding windows, with 10-msec steps, from the onset to 500 msec after the onset of Interactive Mutual Gaze events. For each neuron, we averaged the distribution of spike counts over Self-follow and Other-follow Mutual Gaze events separately and detected the time point at which the average was maximal (Fig. S6c–d). We then calculated the cumulative proportions of cells that exhibited peak spiking activity along the 500-msec period for each brain region and compared the distributions between pairs of regions using Wilcoxon rank sum test.
Overlap of social gaze interaction functions
To examine the overlap of individual cells involved in the three key signatures of social gaze interaction (social discriminability, social gaze monitoring, and mutual eye contact selectivity; Fig. 6a), we calculated the proportion of cells in each brain region that were involved in none, one, two, or all three functions (Fig. 6b–c). Across the four brain regions, we compared the proportion of cells involved in only one function and the proportion of cells involved in at least two functions using Chi-square test with FDR correction. In addition, we compared these two proportions of cells within each brain region. Lastly, we further examined the relationship between social gaze monitoring and mutual eye contact selectivity, the two functions that were specifically critical for social gaze exchanges. For each brain region, we first calculated the proportion of cells with mutual eye contact selectivity that were involved in social gaze monitoring in general, by either tracking Self-distance or Other-distance. We compared each of these proportions to 50% and compared across these proportions using Chi-square test with FDR correction (Fig. S6e). Then, for each region, we calculated the proportion of cells with mutual eye contact selectivity that also significantly tracked Other-distance specifically and compared each of these proportions to 50% and compared across these proportions (Fig. S6f).
Supplementary Material
Key resources table
| REAGENT or RESOURCE | SOURCE | IDENTIFIER |
|---|---|---|
| Critical commercial assays | ||
| Eye tracking camera | SR Research | EyeLink 1000 |
| Headpost | Grey Matter Research | N/A |
| Recording chamber | Crist and Rogue Research Inc. | N/A |
| 16-channel axial array electrodes, U and V probes | Plexon Inc. | N/A |
| Multi-electrode Microdrive system | NaN Instruments | N/A |
| Neural recording data acquisition system | Plexon OmniPlex system | N/A |
| Deposited data | ||
| Raw behavior and electrophysiology data | This paper | Upon request |
| Experimental models: organisms/strains | ||
| Macaca mulatta monkeys | N/A | N/A |
| Software and algorithms | ||
| MATLAB | Mathworks | 2017a-2019b |
| Psychtoolbox | Brainard, 1997 | http://psychtoolbox.org/ |
| EyeLink toolbox | Cornelissen et al., 2002 | http://psychtoolbox.org/docs/EyelinkToolbox |
| EyeMMV toolbox | Krassanakis et al., 2014 | https://github.com/krasvas/EyeMMV |
| MountainSort algorithm | Chung et al., 2017 | https://github.com/magland/mountainlab |
| Codes | This paper |
https://github.com/changlabneuro/pfc_amvg_socialgaze doi: 10.5281/zenodo.6426324 |
Highlights.
Prefrontal and amygdalar neurons show temporal heterogeneity for social gaze events
These neurons participate in monitoring the gaze of self or other
These neurons encode mutual eye contact in an agent-specific fashion
Social gaze interaction is computed widely in the prefrontal-amygdala networks
Acknowledgments
We are extremely grateful to Katalin Gothard, Daeyeol Lee, and Bijan Pesaran for providing helpful feedback about this work. We also thank James McPartland for the discussions on the clinical relevance of our findings in autism. Finally, we thank Olivia Meisner for helpful comments on the manuscript. This work was supported by the National Institute of Mental Health (R01MH110750; R01MH120081).
Footnotes
Publisher's Disclaimer: This is a PDF file of an unedited manuscript that has been accepted for publication. As a service to our customers we are providing this early version of the manuscript. The manuscript will undergo copyediting, typesetting, and review of the resulting proof before it is published in its final form. Please note that during the production process errors may be discovered which could affect the content, and all legal disclaimers that apply to the journal pertain.
Declaration of Interests
The authors declare no competing interests.
References
- Allsop SA, Wichmann R, Mills F, Burgos-Robles A, Chang C-J, Felix-Ortiz AC, Vienne A, Beyeler A, Izadmehr EM, Glober G, et al. (2018). Corticoamygdala transfer of socially derived information gates observational learning. Cell 173, 1329–1342.e18. [DOI] [PMC free article] [PubMed] [Google Scholar]
- Argyle M, and Cook M (1976). Gaze and mutual gaze (Oxford, England: Cambridge U Press; ). [Google Scholar]
- Báez-Mendoza R, Mastrobattista EP, Wang AJ, and Williams ZM (2021). Social agent identity cells in the prefrontal cortex of interacting groups of primates. Science 374, eabb4149. [DOI] [PMC free article] [PubMed] [Google Scholar]
- Barat E, Wirth S, and Duhamel J-R (2018). Face cells in orbitofrontal cortex represent social categories. Proc. Natl. Acad. Sci 115, E11158–E11167. [DOI] [PMC free article] [PubMed] [Google Scholar]
- Basile BM, Schafroth JL, Karaskiewicz CL, Chang SW, and Murray EA (2020). The anterior cingulate cortex is necessary for forming prosocial preferences from vicarious reinforcement in monkeys. PLoS Biology, 18, e3000677. [DOI] [PMC free article] [PubMed] [Google Scholar]
- Brainard DH (1997). The Psychophysics Toolbox. Spat. Vis 10, 433–436. [PubMed] [Google Scholar]
- Chung JE, Magland JF, Barnett AH, Tolosa VM, Tooker AC, Lee KY, Shah KG, Felix SH, Frank LM, and Greengard LF (2017). A fully automated approach to spike sorting. Neuron 95, 1381–1394.e6. [DOI] [PMC free article] [PubMed] [Google Scholar]
- Cornelissen FW, Peters EM, and Palmer J (2002). The Eyelink Toolbox: Eye tracking with MATLAB and the Psychophysics Toolbox. Behav. Res. Methods Instrum. Comput 34, 613–617. [DOI] [PubMed] [Google Scholar]
- Dal Monte O, Piva M, Morris JA, and Chang SWC (2016). Live interaction distinctively shapes social gaze dynamics in rhesus macaques. J. Neurophysiol 116, 1626–1643. [DOI] [PMC free article] [PubMed] [Google Scholar]
- Dal Monte O, Piva M, Anderson KM, Tringides M, Holmes AJ, and Chang SWC (2017). Oxytocin under opioid antagonism leads to supralinear enhancement of social attention. Proc. Natl. Acad. Sci 114, 5247–5252. [DOI] [PMC free article] [PubMed] [Google Scholar]
- Emery NJ (2000). The eyes have it: the neuroethology, function and evolution of social gaze. Neurosci. Biobehav. Rev 24, 581–604. [DOI] [PubMed] [Google Scholar]
- Fan S, Dal Monte O, and Chang SWC (2021). Levels of naturalism in social neuroscience research. IScience 24, 102702. [DOI] [PMC free article] [PubMed] [Google Scholar]
- Feldman R (2007). Parent–infant synchrony: Biological foundations and developmental outcomes. Curr. Dir. Psychol. Sci 16, 340–345. [Google Scholar]
- Freeth M, Foulsham T, and Kingstone A (2013). What affects social attention? Social presence, eye contact and autistic traits. PLOS ONE 8, e53286. [DOI] [PMC free article] [PubMed] [Google Scholar]
- Freiwald WA (2020). Social interaction networks in the primate brain. Curr. Opin. Neurobiol 65, 49–58. [DOI] [PMC free article] [PubMed] [Google Scholar]
- Freiwald WA, and Tsao DY (2010). Functional compartmentalization and viewpoint generalization within the macaque face-processing system. Science 330, 845–851. [DOI] [PMC free article] [PubMed] [Google Scholar]
- Freiwald WA, Tsao DY, and Livingstone MS (2009). A face feature space in the macaque temporal lobe. Nat. Neurosci 12, 1187–1196. [DOI] [PMC free article] [PubMed] [Google Scholar]
- Gangopadhyay P, Chawla M, Dal Monte O, and Chang SWC (2021). Prefrontal-amygdala circuits in social decision-making. Nat. Neurosci 24, 5–18. [DOI] [PMC free article] [PubMed] [Google Scholar]
- Gilardeau S, Cirillo R, Jazayeri M, Dupuis C, Wirth S, and Duhamel J-R (2021). Two functions of the primate amygdala in social gaze. Neuropsychologia 157, 107881. [DOI] [PubMed] [Google Scholar]
- Gothard KM, Erickson CA, and Amaral DG (2004). How do rhesus monkeys (Macaca mulatta) scan faces in a visual paired comparison task? Anim. Cogn 7, 25–36. [DOI] [PubMed] [Google Scholar]
- Gothard KM, Battaglia FP, Erickson CA, Spitler KM, and Amaral DG (2007). Neural responses to facial expression and face identity in the monkey amygdala. J. Neurophysiol 97, 1671–1683. [DOI] [PubMed] [Google Scholar]
- Grabenhorst F, Báez-Mendoza R, Genest W, Deco G, and Schultz W (2019). Primate amygdala neurons simulate decision processes of social partners. Cell 177, 986–998.e15. [DOI] [PMC free article] [PubMed] [Google Scholar]
- Hari R, Henriksson L, Malinen S, and Parkkonen L (2015). Centrality of Social Interaction in Human Brain Function. Neuron 88, 181–193. [DOI] [PubMed] [Google Scholar]
- Haroush K, and Williams ZM (2015). Neuronal prediction of opponent’s behavior during cooperative social interchange in primates. Cell 160, 1233–1245. [DOI] [PMC free article] [PubMed] [Google Scholar]
- Haxby JV, Hoffman EA, and Gobbini MI (2000). The distributed human neural system for face perception. Trends Cog. Sci 4, 223–233. [DOI] [PubMed] [Google Scholar]
- Hayward DA, Voorhies W, Morris JL, Capozzi F, and Ristic J (2017). Staring reality in the face: A comparison of social attention across laboratory and real world measures suggests little common ground. Can. J. Exp. Psychol. Rev. Can. Psychol. Exp 71, 212–225. [DOI] [PubMed] [Google Scholar]
- Itier RJ, and Batty M (2009). Neural bases of eye and gaze processing: the core of social cognition. Neurosci. Biobehav. Rev 33, 843–863. [DOI] [PMC free article] [PubMed] [Google Scholar]
- Jennings JH, Kim CK, Marshel JH, Raffiee M, Ye L, Quirin S, Pak S, Ramakrishnan C, and Deisseroth K (2019). Interacting neural ensembles in orbitofrontal cortex for social and feeding behaviour. Nature 565, 645–649. [DOI] [PMC free article] [PubMed] [Google Scholar]
- Jovanovic V, Fishbein AR, de la Mothe L, Lee KF, & Miller CT (2022). Behavioral context affects social signal representations within single primate prefrontal cortex neurons. Neuron, doi: 10.1016/j.neuron.2022.01.020. [DOI] [PMC free article] [PubMed] [Google Scholar]
- Kano F, Shepherd SV, Hirata S, and Call J (2018). Primate social attention: Species differences and effects of individual experience in humans, great apes, and macaques. PLOS ONE 13, e0193283. [DOI] [PMC free article] [PubMed] [Google Scholar]
- Kanwisher N, McDermott J, and Chun MM (1997). The fusiform face area: A module in human extrastriate cortex specialized for face perception. J. Neurosci 17, 4302–4311. [DOI] [PMC free article] [PubMed] [Google Scholar]
- Kingsbury L, Huang S, Raam T, Ye LS, Wei D, Hu RK, Ye L, and Hong W (2020). Cortical representations of conspecific sex shape social behavior. Neuron 107, 941–953.e7. [DOI] [PMC free article] [PubMed] [Google Scholar]
- Koyano KW, Jones AP, McMahon DBT, Waidmann EN, Russ BE, and Leopold DA (2021). Dynamic suppression of average facial structure shapes neural tuning in three macaque face patches. Curr. Biol 31, 1–12.e5. [DOI] [PMC free article] [PubMed] [Google Scholar]
- Krassanakis V, Filippakopoulou V, and Nakos B (2014). EyeMMV toolbox: An eye movement post-analysis tool based on a two-step spatial dispersion threshold for fixation identification. J. Eye Mov. Res 7. [Google Scholar]
- Landi SM, Viswanathan P, Serene S, and Freiwald WA (2021). A fast link between face perception and memory in the temporal pole. Science 373, 581–585. [DOI] [PMC free article] [PubMed] [Google Scholar]
- Leopold DA, Bondar IV, and Giese MA (2006). Norm-based face encoding by single neurons in the monkey inferotemporal cortex. Nature 442, 572–575. [DOI] [PubMed] [Google Scholar]
- Livneh U, Resnik J, Shohat Y, and Paz R (2012). Self-monitoring of social facial expressions in the primate amygdala and cingulate cortex. Proc. Natl. Acad. Sci 109, 18956–18961. [DOI] [PMC free article] [PubMed] [Google Scholar]
- Marciniak K, Atabaki A, Dicke PW, and Thier P (2014). Disparate substrates for head gaze following and face perception in the monkey superior temporal sulcus. eLife 3, e03222. [DOI] [PMC free article] [PubMed] [Google Scholar]
- McAlonan K, Cavanaugh J, and Wurtz RH (2008). Guarding the gateway to cortex with attention in visual thalamus. Nature 456, 391–394. [DOI] [PMC free article] [PubMed] [Google Scholar]
- McCarthy G, Puce A, Gore JC, and Allison T (1997). Face-specific processing in the human fusiform gyrus. J. Cogn. Neurosci 9, 605–610. [DOI] [PubMed] [Google Scholar]
- McMahon DBT, Russ BE, Elnaiem HD, Kurnikova AI, and Leopold DA (2015). Single-unit activity during natural vision: diversity, consistency, and spatial sensitivity among AF face patch neurons. J. Neurosci 35, 5537–5548. [DOI] [PMC free article] [PubMed] [Google Scholar]
- Meyers E (2013). The neural decoding toolbox. Front. Neuroinformatics 7, 8. [DOI] [PMC free article] [PubMed] [Google Scholar]
- Meyers EM, Borzello M, Freiwald WA, & Tsao D (2015). Intelligent information loss: the coding of facial identity, head pose, and non-face information in the macaque face patch system. J. Neurosci 35, 7069–7081. [DOI] [PMC free article] [PubMed] [Google Scholar]
- Meyers EM, Liang A, Katsuki F, and Constantinidis C (2018). Differential processing of isolated object and multi-item pop-out displays in LIP and PFC. Cereb. Cortex 28, 3816–3828. [DOI] [PMC free article] [PubMed] [Google Scholar]
- Mosher CP, Zimmerman PE, and Gothard KM (2014). Neurons in the Monkey Amygdala Detect Eye Contact during Naturalistic Social Interactions. Curr. Biol 24, 2459–2464. [DOI] [PMC free article] [PubMed] [Google Scholar]
- Munuera J, Rigotti M, and Salzman CD (2018). Shared neural coding for social hierarchy and reward value in primate amygdala. Nat. Neurosci 21, 415–423. [DOI] [PMC free article] [PubMed] [Google Scholar]
- Murray EA, and Fellows LK (2021). Prefrontal cortex interactions with the amygdala in primates. Neuropsychopharmacology 1–17. [DOI] [PMC free article] [PubMed] [Google Scholar]
- Nummela SU, Jovanovic V, Mothe L de la, and Miller CT (2017). Social Context-Dependent Activity in Marmoset Frontal Cortex Populations During Natural Conversations. J. Neurosci 37, 7036–7047. [DOI] [PMC free article] [PubMed] [Google Scholar]
- Paxinos G, Huang X-F, and Toga AW (1999). The rhesus monkey brain in stereotaxic coordinates (San Diego, CA: Academic Press; ). [Google Scholar]
- Pönkänen LM, Alhoniemi A, Leppänen JM, and Hietanen JK (2011). Does it make a difference if I have an eye contact with you or with your picture? An ERP study. Soc. Cogn. Affect. Neurosci 6, 486–494. [DOI] [PMC free article] [PubMed] [Google Scholar]
- Pryluk R, Shohat Y, Morozov A, Friedman D, Taub AH, and Paz R (2020). Shared yet dissociable neural codes across eye gaze, valence and expectation. Nature 586, 95–100. [DOI] [PubMed] [Google Scholar]
- Ramezanpour H, and Thier P (2020). Decoding of the other’s focus of attention by a temporal cortex module. Proc. Natl. Acad. Sci 117, 2663–2670. [DOI] [PMC free article] [PubMed] [Google Scholar]
- Redcay E, and Schilbach L (2019). Using second-person neuroscience to elucidate the mechanisms of social interaction. Nat. Rev. Neurosci 20, 495–505. [DOI] [PMC free article] [PubMed] [Google Scholar]
- Risko EF, Richardson DC, and Kingstone A (2016). Breaking the fourth wall of cognitive science: Real-world social attention and the dual function of gaze. Curr. Dir. Psychol. Sci 25, 70–74. [Google Scholar]
- Rolls ET, Critchley HD, Browning AS, and Inoue K (2006). Face-selective and auditory neurons in the primate orbitofrontal cortex. Exp. Brain Res 170, 74–87. [DOI] [PubMed] [Google Scholar]
- Rudebeck PH, Buckley MJ, Walton ME, and Rushworth MF (2006). A role for the macaque anterior cingulate gyrus in social valuation. Science, 313, 1310–1312. [DOI] [PubMed] [Google Scholar]
- Rutishauser U, Tudusciuc O, Neumann D, Mamelak AN, Heller AC, Ross IB, Philpott L, Sutherling WW, and Adolphs R (2011). Single-unit responses selective for whole faces in the human amygdala. Curr. Biol 21, 1654–1660. [DOI] [PMC free article] [PubMed] [Google Scholar]
- Schilbach L, Timmermans B, Reddy V, Costall A, Bente G, Schlicht T, and Vogeley K (2013). Toward a second-person neuroscience. Behav. Brain Sci 36, 393–414. [DOI] [PubMed] [Google Scholar]
- Shepherd SV, and Freiwald WA (2018). Functional networks for social communication in the macaque monkey. Neuron 99, 413–420.e3. [DOI] [PMC free article] [PubMed] [Google Scholar]
- Sliwa J, and Freiwald WA (2017). A dedicated network for social interaction processing in the primate brain. Science 356, 745–749. [DOI] [PMC free article] [PubMed] [Google Scholar]
- Tsao DY, Freiwald WA, Tootell RBH, and Livingstone MS (2006). A cortical region consisting entirely of face-selective cells. Science 311, 670–674. [DOI] [PMC free article] [PubMed] [Google Scholar]
- Tsao DY, Moeller S, and Freiwald WA (2008). Comparing face patch systems in macaques and humans. Proc. Natl. Acad. Sci 105, 19514–19519. [DOI] [PMC free article] [PubMed] [Google Scholar]
- Wang S, Yu R, Tyszka JM, Zhen S, Kovach C, Sun S, Huang Y, Hurlemann R, Ross IB, Chung JM, et al. (2017). The human amygdala parametrically encodes the intensity of specific facial emotions and their categorical ambiguity. Nat. Commun 8, 14821. [DOI] [PMC free article] [PubMed] [Google Scholar]
- Yoshida K, Saito N, Iriki A, and Isoda M (2012). Social error monitoring in macaque frontal cortex. Nat. Neurosci 15, 1307–1312. [DOI] [PubMed] [Google Scholar]
Associated Data
This section collects any data citations, data availability statements, or supplementary materials included in this article.
Supplementary Materials
Data Availability Statement
Behavioral and neural data presented in this paper will be available upon request from the lead contact. Original codes can be found at https://github.com/changlabneuro/pfc_amyg_socialgaze.