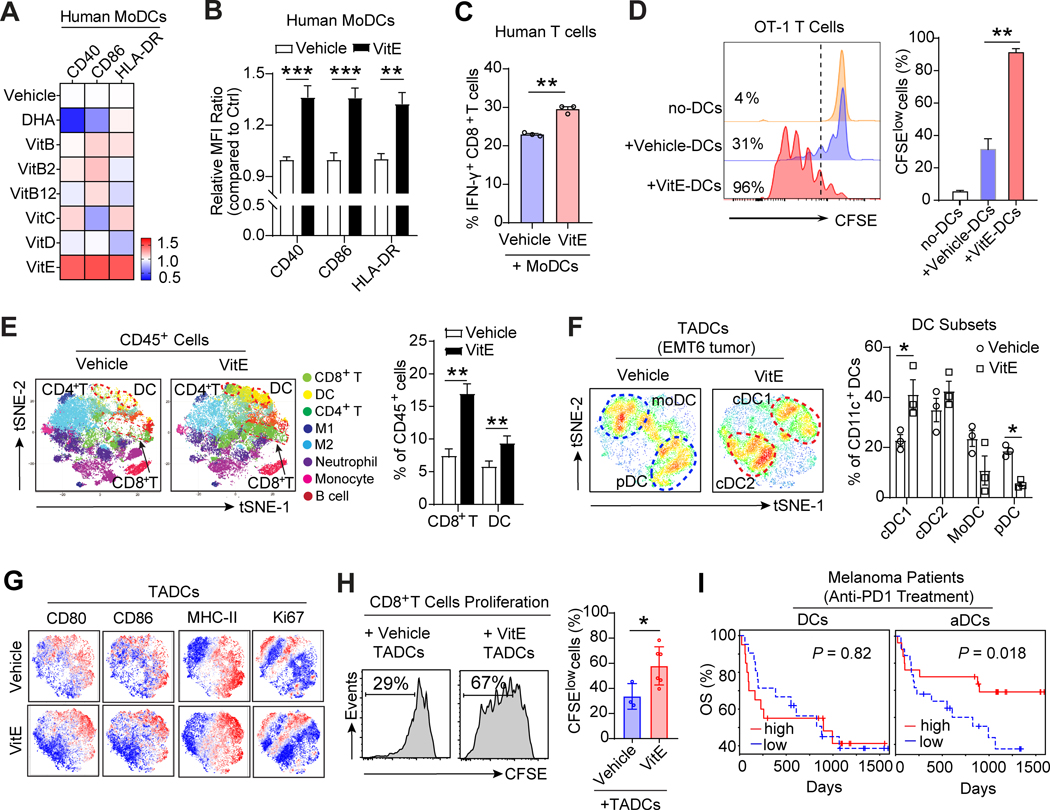
Figure 2. VitE enhances DCs activation in vitro and reinvigorates DCs function in vivo.
A, Heat-map depicting relative expressions of co-stimulatory molecules in human MoDCs treated with indicated dietary supplements, including VitE (50μg/ml), VitC (20μg/ml), VitD (100ng/ml), VitB (folate, 200ng/ml), VitB2 (2μg/ml), VitB12 (10ng/ml), and DHA (Omega-3, 100μM) for 48h, and then stimulated with LPS (20ng/ml) for 24h. The mean fluorescence intensity (MFI) of each molecule was normalized to the MFI of the vehicle-treated group measured by flow cytometry.
B, Quantification of the indicated DC activation marker expressions in human MoDCs treated with vehicle or VitE (50μg/ml) for 48h in the presence of LPS (20ng/ml), and MFI were calculated relative to vehicle treatment (defined as 1).
C, Percentage of human IFN-γ+CD8+ T cells out of total CD8+ T cells in coculture with the vehicle- or VitE-treated autologous MoDCs (n=3).
D, Representative flow cytometric analysis and quantification of antigen-specific OT-1 T cell proliferation cocultured with the vehicle- or VitE-treated and OVA-loaded mouse BMDCs at day3.
E, t-Distributed stochastic neighbor embedding (t-SNE) plot of tumor-infiltrating CD45+ immune cells overlaid with color-coded clusters from the vehicle- or VitE-treated EMT6 tumors. Dotted ellipses highlight clusters with significant differences between the two groups at day 15 post-implantation (n=6). The quantification of CD8+ T cells and DCs are shown (left panel, n=6).
F, The overlaid density plots of CD11c+ tumor-associated dendritic cells (TADCs) from vehicle- or VitE-treated EMT6 tumors in BALB/c mice. The quantification of distinct DCs subsets was shown (left panel, n=3). The distinct DCs subsets are labeled: cDC1, conventional type 1 DC; cDC2, conventional type 2 DC; pDC, plasmacytoid DC; MoDC, monocyte-derived DC.
G, t-SNE plots of TADCs overlaid with the expressions of indicated markers from the vehicle- versus VitE-treated EMT6 mammary tumors.
H, Representative histograms of CD8+ T cell proliferation. CD8+ T cells were cocultured with TADCs at 10:1 ratio (left panel) and quantified using CFSE dilution (right panel). TADCs were purified from EMT6 tumor-bearing mice at day 10 post-treatment with vehicle or VitE.
I, Overall survival of melanoma patients who had tumor-infiltrating total DCs high (n=20) vs. low (n=21) or activated DCs (aDCs) high (n=20) vs. low (n=21) before anti-PD-1 treatment. High and low were defined as higher or lower, respectively, than the median for the cohort (PRJEB23709).
Mean ± s.e.m (B, C, D, E, F, H, I). Two-sided Student’s t-test (B, C, E, F, H). One-way analysis of variance (ANOVA) and Tukey’s test for multiple comparisons (D), log-rank (Mantel-Cox) test survival comparison (I). The statistical significance is defined by P-value: *P < 0.05, **P < 0.01, ***P < 0.001.

