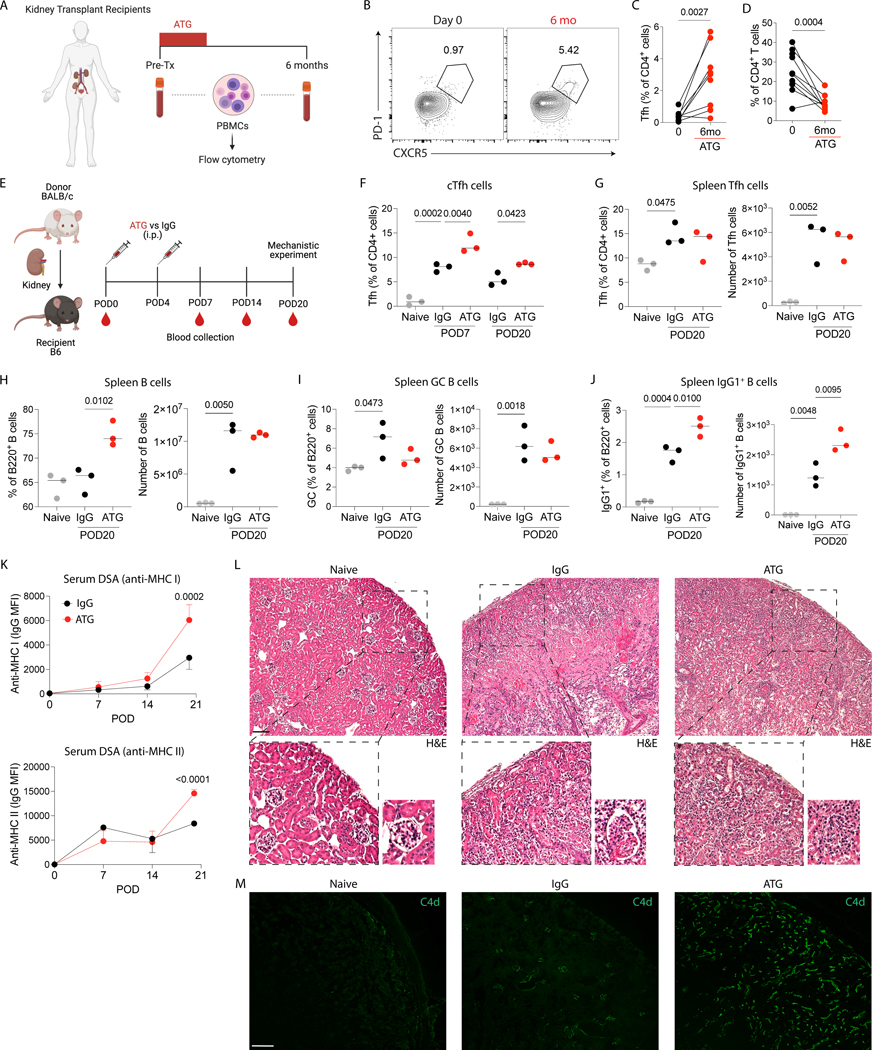
Figure 1.
ATG treatment increases the proportion of Tfh cells in kidney transplant recipients and the alloantibody response in a mouse kidney transplant model. (A) PBMCs from kidney transplant recipients before and six months after kidney transplantation were isolated and characterized by flow cytometry. (B) Representative flow cytometry contour plots, and (C) the frequency of circulating Tfh (CD4+CXCR5+PD-1+) cells and (D) total CD4+ T cells (data from 10 patients; Wilcoxon matched-pairs signed-rank test). (E) BALB/c donor kidneys were transplanted into C57Bl/6 recipients, and the recipients were intraperitoneally treated with 500 μg of murine ATG or IgG control at POD0 and POD4. Mice were euthanized at POD20 after immunization, and blood, graft and spleens were analyzed. Naïve mice were used as additional controls. (F) The frequency of circulating Tfh cells at POD7 and POD20. The frequency and absolute cell number of (G) Tfh cells, (H) total B cells, (I) GC B cells and (J) IgG1+ B cells at POD20 in the spleen. (K) Anti-MHC I and anti-MHC II DSA quantification in the serum over time post-transplantation. (L) Representative H&E and (M) C4d staining in the grafts at POD20. Scale bar, 100 μm. (E-M) Data as mean ± SD are shown (n = 3 per group; statistic by One-Way ANOVA with Tukey multiple comparisons test).

