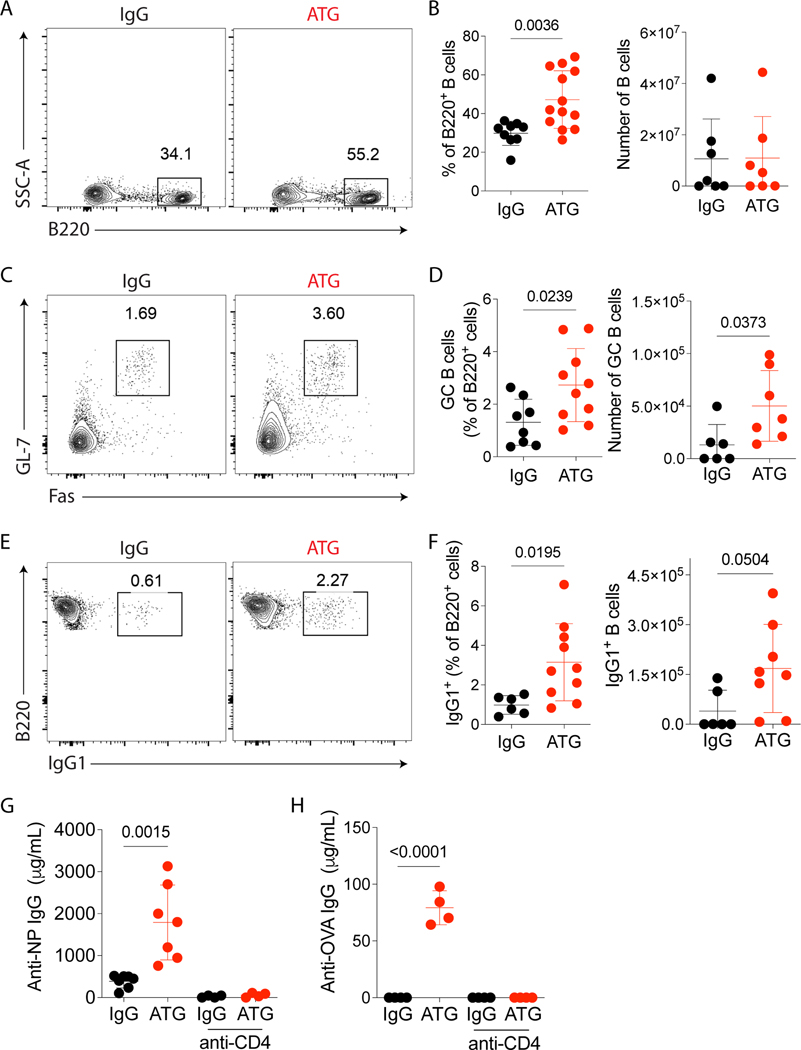
Figure 3.
ATG treatment enhances antibody-specific immune response. C57Bl/6 mice were subcutaneously immunized with NP-OVA + CFA and intraperitoneally treated with 500 μg of murine ATG or IgG control. Mice were euthanized on day 8 after immunization, lymph nodes were analyzed by flow cytometry, as shown in Fig 2A. (A) Representative contour plots of B220+ B cells in lymph nodes gated in Dump-Live cells. (B) The frequency and absolute cell number of B220+ B cells in lymph nodes. (C) Representative contour plots of GC B (B220+GL-7+Fas+) cells in lymph nodes gated in B220+ cells. (D) The frequency and absolute cell number per lymph node of GC B cells. (E) Representative contour plots of B220+ IgG1+ cells in lymph nodes gated in B220+ cells. (F) The frequency and absolute cell number per lymph node of IgG1+ B cells. (G) ELISA quantification of serum NP-specific IgG antibodies and (H) OVA-specific IgG antibodies at day 8 after immunization in controls or ATG-treated mice with subsequent selective depletion of CD4 cells (anti-CD4 depleting antibody). (A-H) Red dots represent the ATG-treated mice, and the black dots represent the IgG-treated mice. Data as mean ± SD are shown (pooled data from three independent experiments, with n = 4–5 per group;). (B, D, and F) Statistic by t-test. (G-H) Statistic by Two-way ANOVA with Tukey multiple comparisons test.

