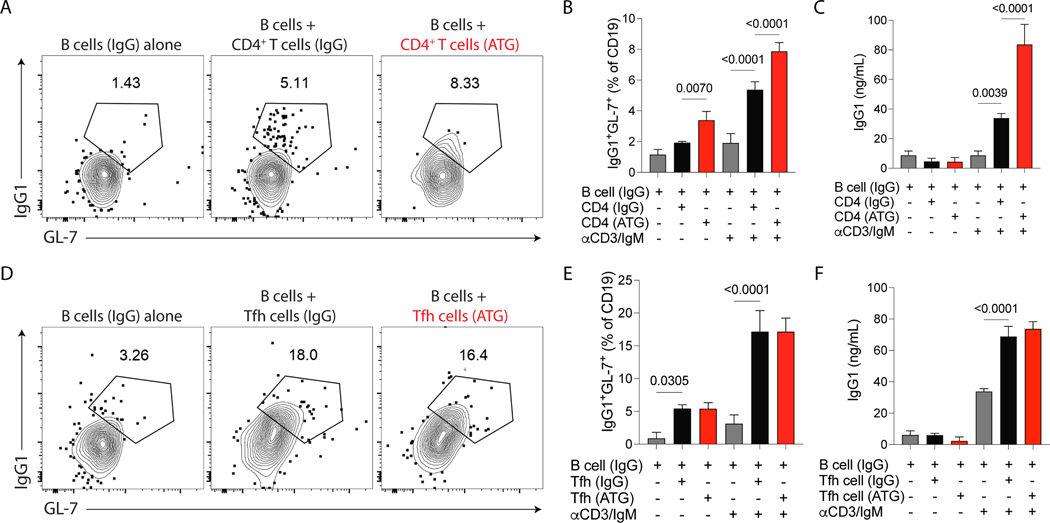
Figure 4.
Total CD4+ T cells from ATG-treated mice have an increased capacity to induce help to B cells in vitro. C57Bl/6 mice were subcutaneously immunized with NP-OVA + CFA and treated with 500 μg of murine ATG or IgG control. Mice were sacrificed at day 8 after immunization, and B cells, total CD4+ T cells or Tfh cells were sorted from the spleen and cocultured in vitro for 6 days in the presence or not of anti-CD3 and anti-IgM stimulation. (A) Representative contour plots and (B) frequency of IgG1+ GC B cells (B220+GL-7+IgG1+) in B cells cultured with total CD4+ T cells. The IgG1+ GC B cells are gated on CD19+ MHCII+ cells. (C) ELISA quantification of IgG1 antibodies in the supernatant of total CD4+ T cells cultured with B cells. (D) Representative contour plots and (E) frequency of IgG1+ GC B cells (B220+GL-7+IgG1+) in B cells cultured with total Tfh cells. The IgG1+ GC B cells are gated on CD19+ MHCII+ cells. (F) ELISA quantification of IgG1 antibodies in the supernatant of Tfh cells cultured with B cells. (A-F) All the B cells were from IgG-treated animals. Grey bars represent B cells alone, the black bars represent B cells coculture with CD4+ T cells or Tfh cells from IgG-treated mice, and the red bars represent B cells coculture with CD4+ T cells or Tfh cells from ATG-treated mice. Data as mean ± SD are shown (pooled data from three independent experiments; One-way ANOVA with Tukey multiple comparisons test).

