Figure 6.
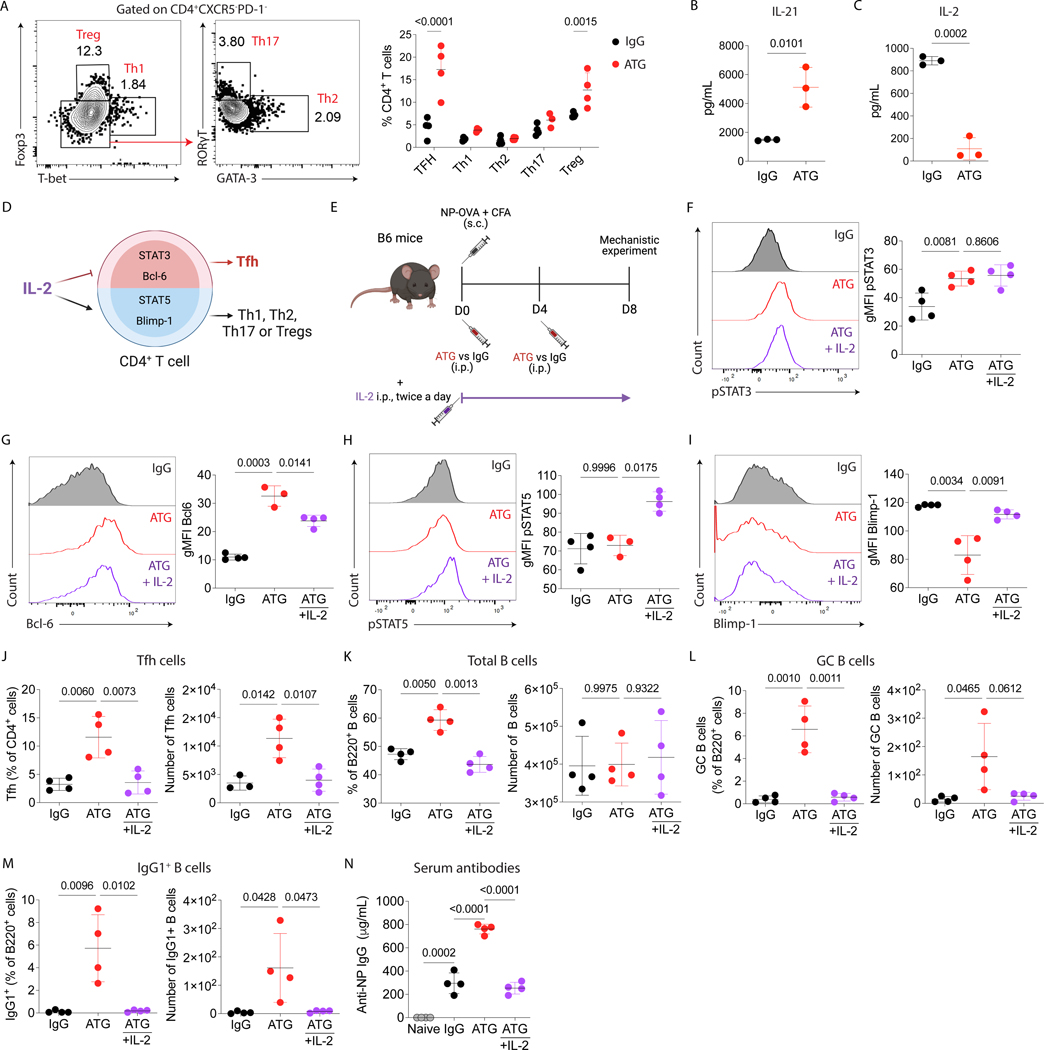
IL-2 signaling inhibits ATG-mediated humoral response. Using the NP-OVA + CFA immunization with either IgG or ATG treatment as shown in Fig 1D, we determined (A) the frequency of Tfh (CD4+CXCR5+PD-1+), Th1 (CD4+CXCR5-PD-1-FOXP3-Tbet+), Th2 (CD4+CXCR5-PD-1-FOXP3-Tbet-Gata3+), Th17 (CD4+CXCR5-PD-1-FOXP3-Tbet-RORyT+), and Treg (CD4+CXCR5- PD-1-FOXP3+ Tbet-) cells at day 8 after NP-OVA + CFA immunization in lymph nodes, (B) serum IL-21 levels after 48 hours of immunization with NP-OVA+CFA, and the (C) serum IL-2 levels after 6 hours of immunization with NP-OVA + CFA with IgG or ATG treatment. (D) Cartoon of the IL-2 signaling pathway in CD4+ T cell differentiation. (E) C57Bl/6 mice were subcutaneously immunized with NP-OVA+CFA and treated with 500 μg of murine ATG or IgG control. A subgroup then received ATG and 30,000 U of recombinant mouse IL-2, intraperitoneally, twice a day. Mice were euthanized at day 8 after immunization, and serum and lymph nodes were analyzed, as shown in Fig 2A. Quantification of the geometric mean fluorescence intensity (gMFI) of (F) pSTAT3, (G) Bcl6, (H) pSTAT5, and (I) Blimp-1 in CD4+ T cells from draining lymph nodes. Red histograms and red dots represent the ATG-treated mice, black histogram and dots represent the IgG-treated mice, and the purple histograms and dots represent the ATG-treated mice that received IL-2. The frequency and absolute cell number of (J) Tfh cells, (K) total B cells, (L) GC B cells, and (M) IgG1+ B cells in the draining lymph node. (N) ELISA quantification of serum NP-specific IgG antibodies at day 8 after immunization. Naïve mice were used as additional controls. Data as mean ± SD are shown (n = 4 per group; One-way ANOVA with Tukey multiple comparisons test).

