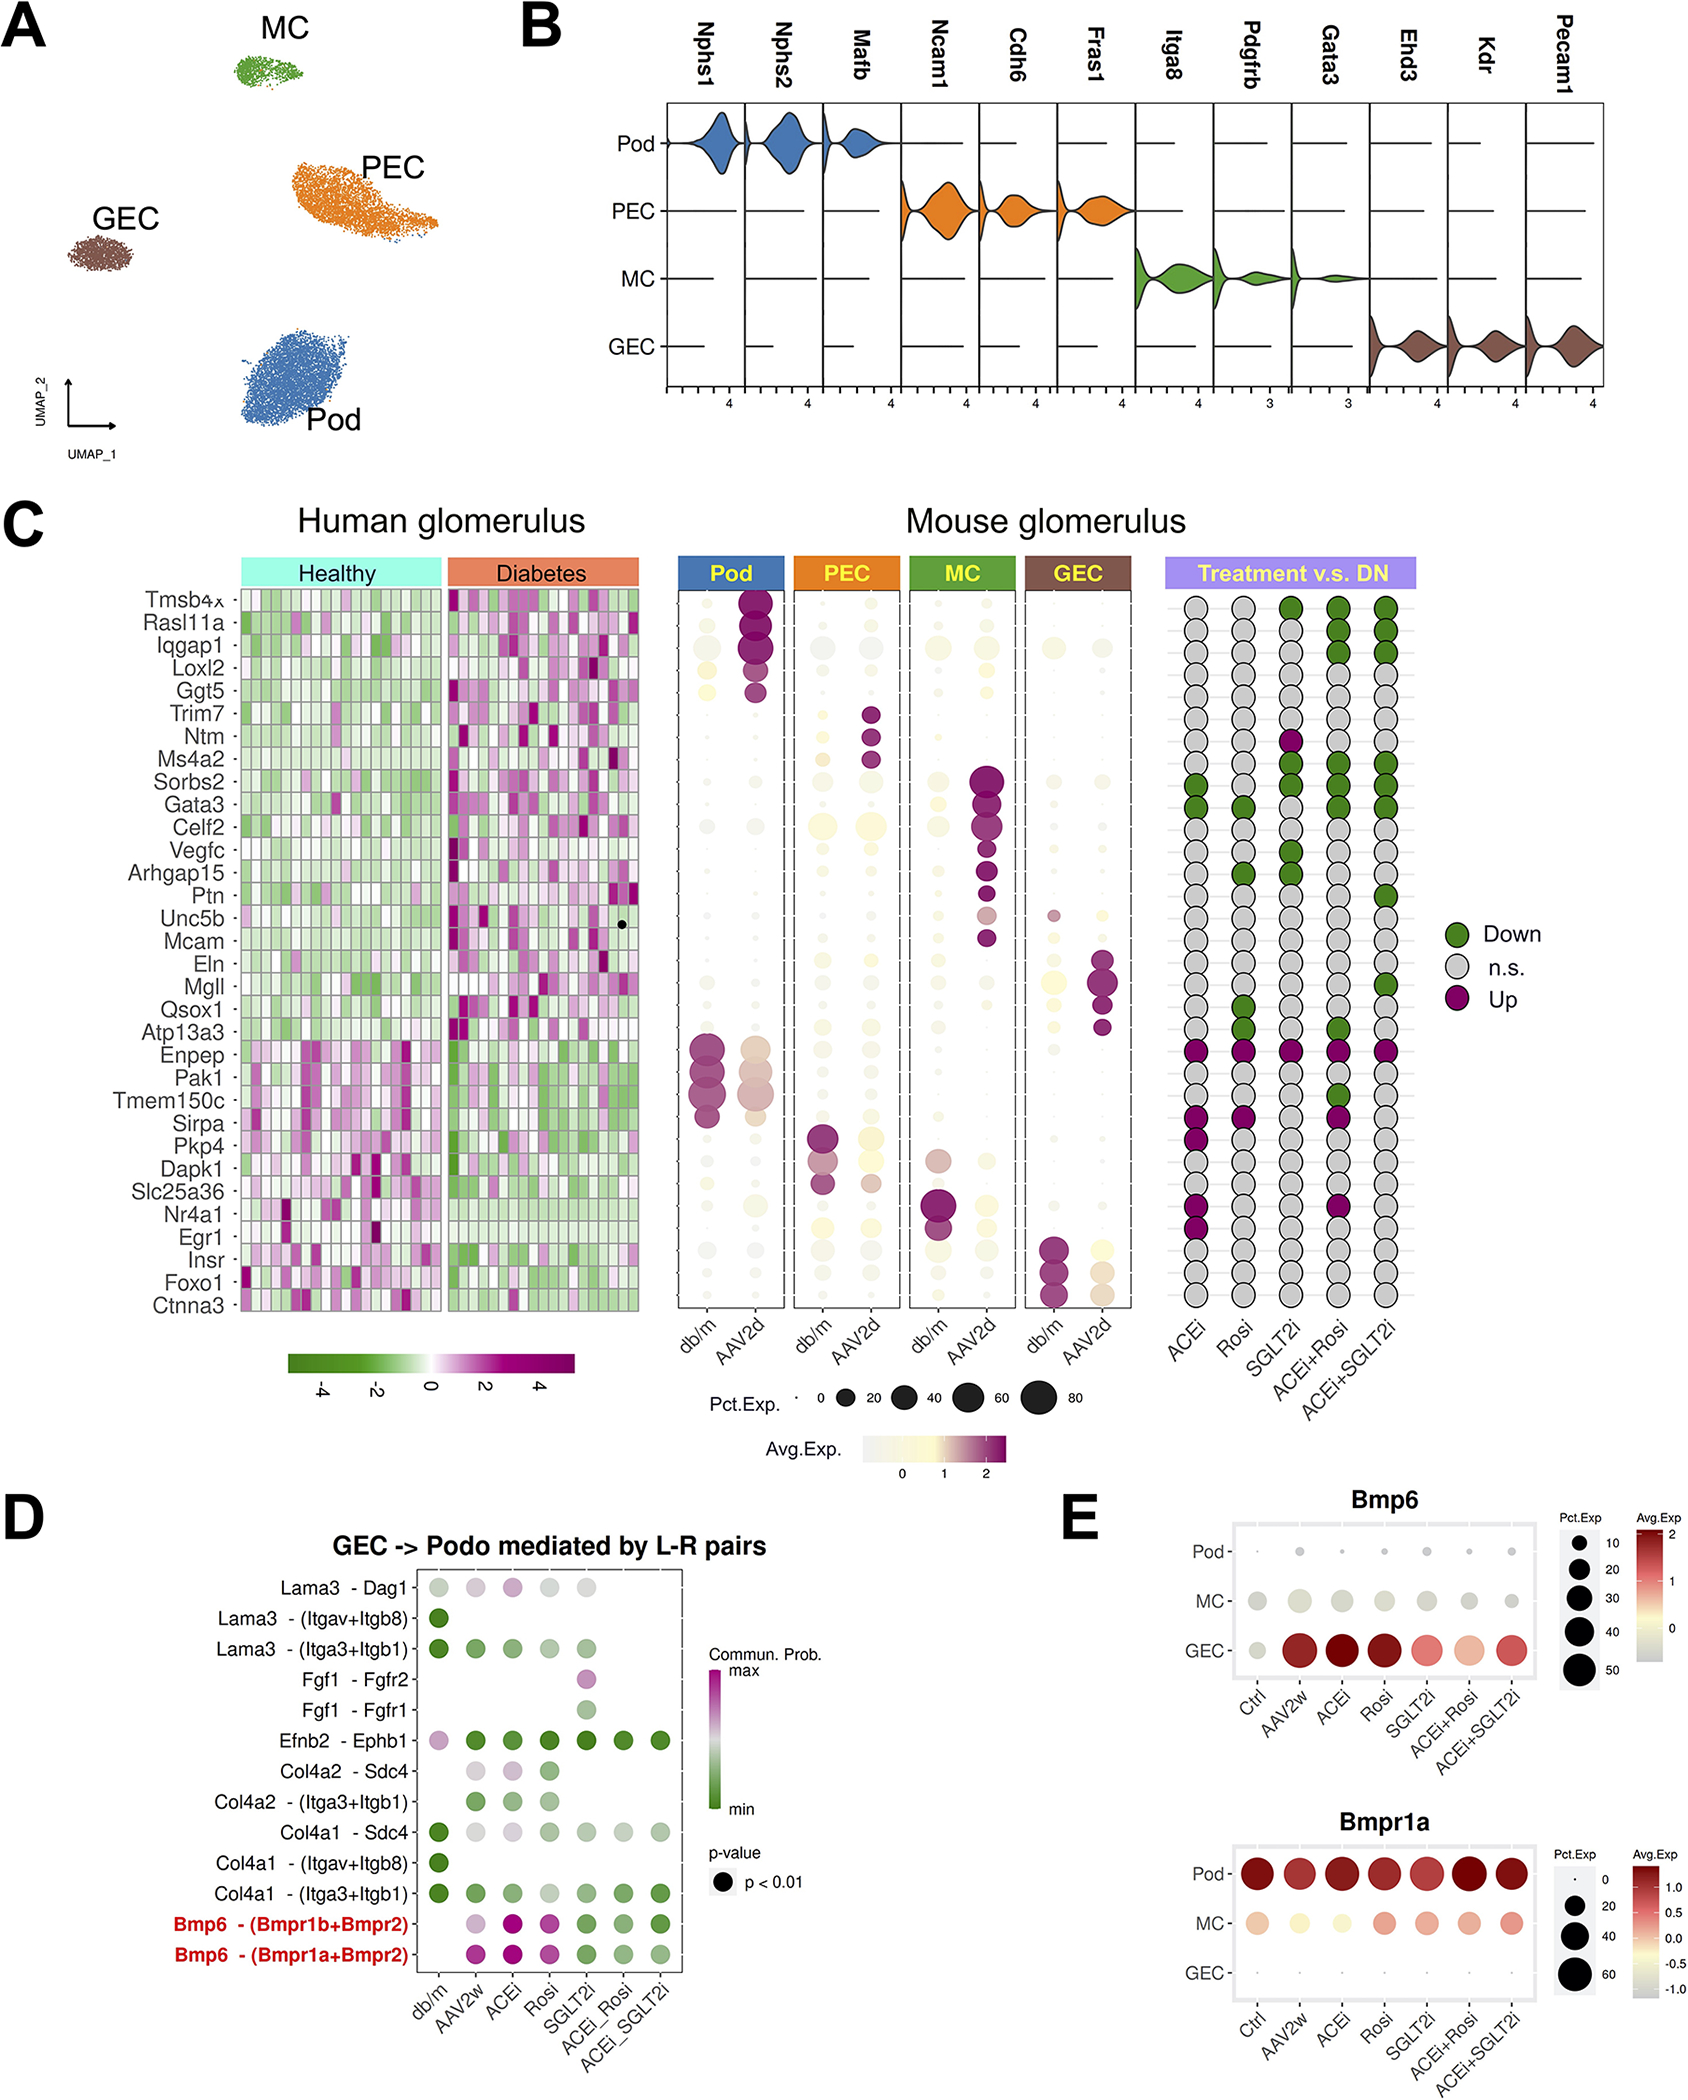
Figure 6. Glomerular communication networks in diabetes and its treatment.

(A) Reclustering of the glomerular cells.
(B) Cell specific marker genes define glomerular subtypes.
(C) Human glomerulus DKD genes mapped to mouse glomerulus cell types. The left heatmap shows bulk glomerulus expression in healthy vs. DKD. The dot plot in the middle assigns those same genes to mouse glomerulus cell types. The dot plot on the right shows that some of these genes are normalized by therapy.
(D) Ligand-receptor scoring for glomerular endothelial cell signaling to podocytes.
(E) Bmp6 and its receptor Bmpr1a expression in glomerulus during diabetes and its treatment.
