. 2022 Apr 22;20(7):1013–1020. doi: 10.1158/1541-7786.MCR-21-0683

Figure 2.

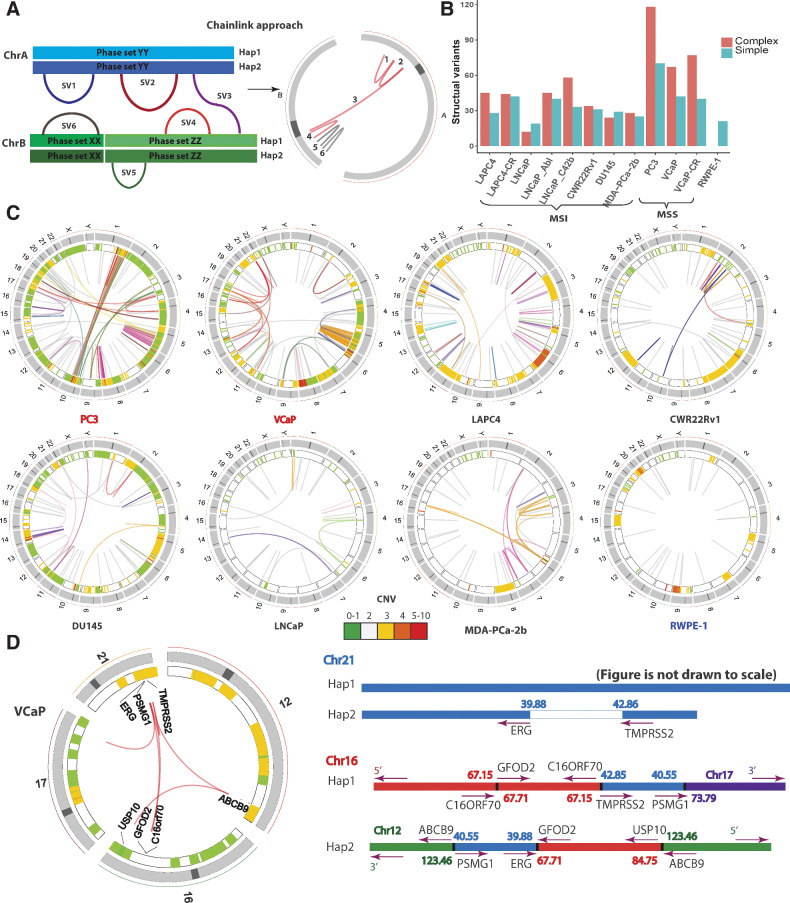
Figure 2. Identification and phasing of structural alterations. A, The ChainLink approach uses phase information for each breakpoint to chain together complex SVs. In this schematic, SV 1, 2, 3, 4 on two different chromosomes are chained together into a complex SV cluster based on phase information on each breakpoint; SV 5 and 6 are considered simple SVs. B, Number of SVs classified as simple or complex in each cell line. C, Circos plots representing CNV and SVs on the eight parental cell lines in this study: MSI stable (red), MSI high (black), and nonmalignant immortalized prostatic epithelium (navy). Heatmap track beneath chromosome ideograms represents CNV with colors representing copy number. Innermost link track represents large SVs: complex SVs are colored by chain; simple SVs are gray. D, Left: Circos plot showing the chromoplexy event associated with the TMPRSS2-ERG fusion gene formation in VCaP. Genes interrupted by these SVs are labeled on the innermost track. Right: genomic anatomy of the breakpoints involved in the chromoplexy event leading to the TMPRSS2-ERG fusion gene in VCaP and detailed rearrangement configuration of the 3 Mb sequence between the TMPRSS2-ERG genomic breakpoint. Genomic coordinates are in Mb per reference genome hg19. Arrows represent gene direction.

Identification and phasing of structural alterations. A, The ChainLink approach uses phase information for each breakpoint to chain together complex SVs. In this schematic, SV 1, 2, 3, 4 on two different chromosomes are chained together into a complex SV cluster based on phase information on each breakpoint; SV 5 and 6 are considered simple SVs. B, Number of SVs classified as simple or complex in each cell line. C, Circos plots representing CNV and SVs on the eight parental cell lines in this study: MSI stable (red), MSI high (black), and nonmalignant immortalized prostatic epithelium (navy). Heatmap track beneath chromosome ideograms represents CNV with colors representing copy number. Innermost link track represents large SVs: complex SVs are colored by chain; simple SVs are gray. D, Left: Circos plot showing the chromoplexy event associated with the TMPRSS2-ERG fusion gene formation in VCaP. Genes interrupted by these SVs are labeled on the innermost track. Right: genomic anatomy of the breakpoints involved in the chromoplexy event leading to the TMPRSS2-ERG fusion gene in VCaP and detailed rearrangement configuration of the 3 Mb sequence between the TMPRSS2-ERG genomic breakpoint. Genomic coordinates are in Mb per reference genome hg19. Arrows represent gene direction.