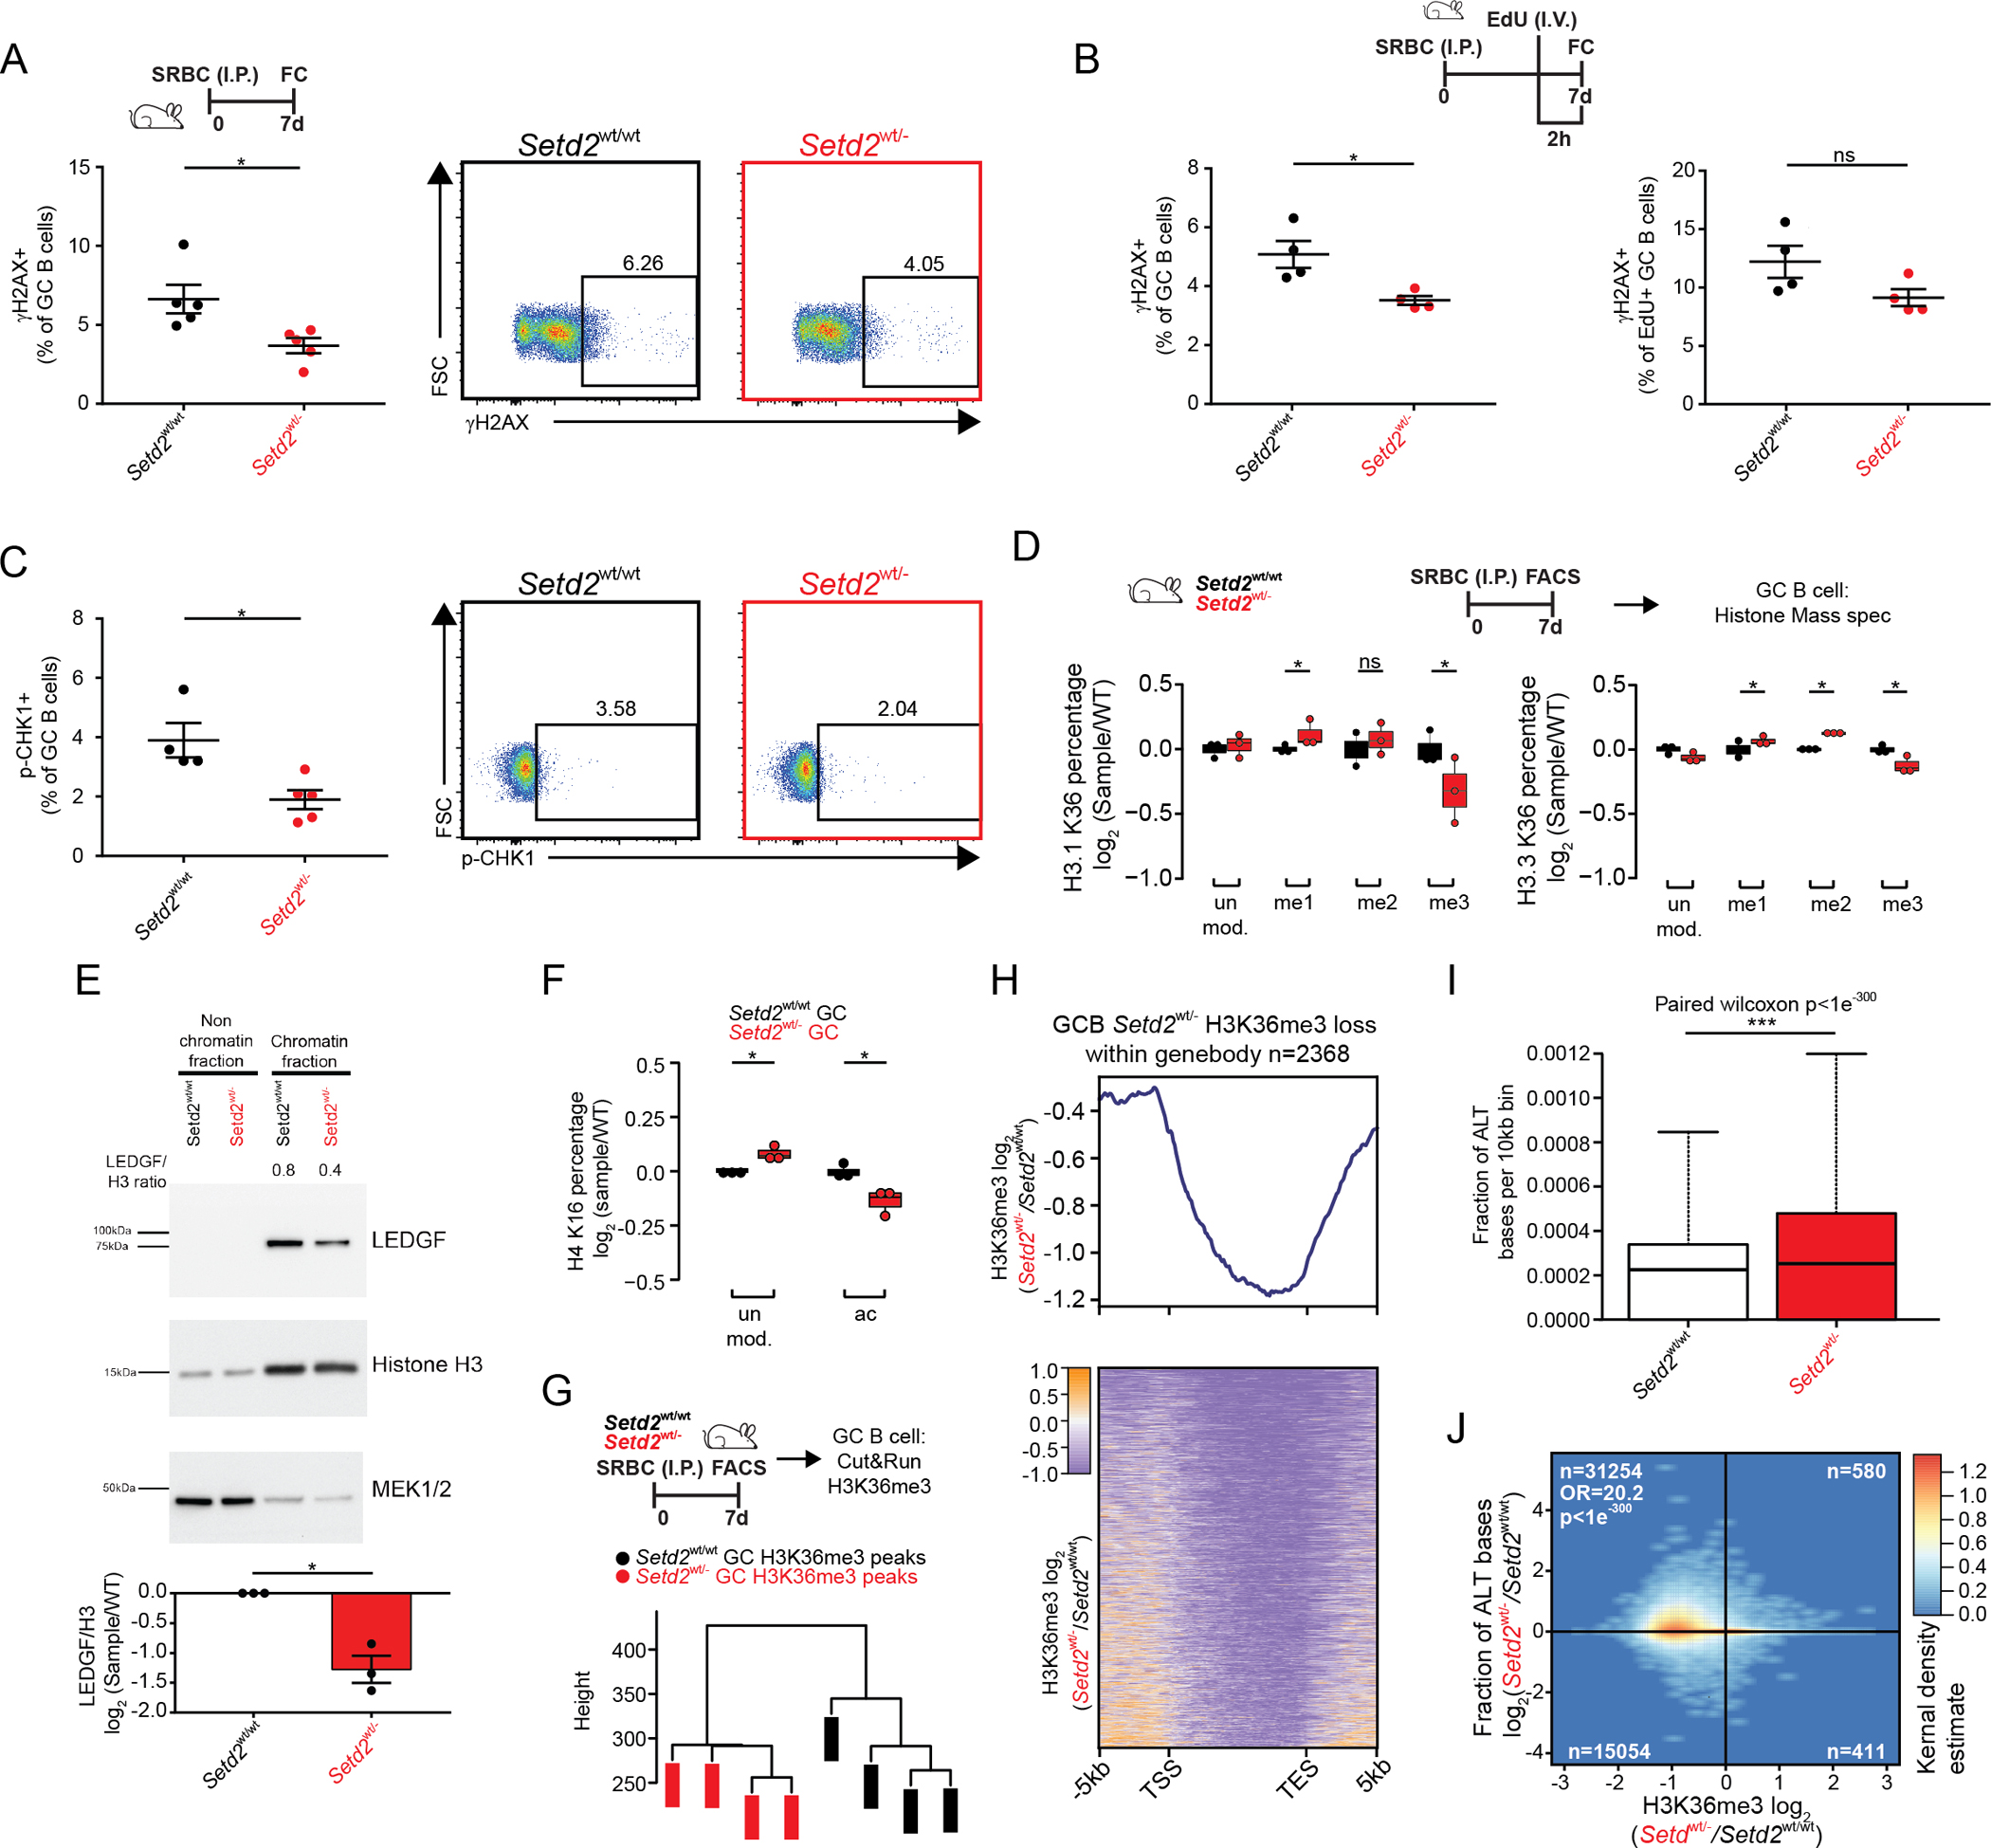
Figure 3. Setd2 haploinsufficiency impairs DNA damage sensing.

A-C) Representative flow cytometry plots and quantification of γH2AX (A-B) or p-CHK1 (C) stained GCB cells from Setd2wt/wt (n=5) and Setd2wt/− (n=5) mice immunized with SRBC and sacrificed on day 7. Mice were injected with EdU two hours prior to sacrifice (B).
D) Normalized abundance of H3.1 and H3.3 K36 quantified by liquid chromatography separation and mass spectrometry of histones from SRBC immunized mice (n=3).
E) Chromatin fractionation and western blot of LEDGF, Histone H3 and MEK1/2 from GCB cells.
F) Normalized abundance of H4K16 and H4K16ac quantified by liquid chromatography separation and mass spectrometry of histones from SRBC immunized mice (n=3).
G) Hierarchical clustering of H3K36me3 bound peaks by CUT&RUN (n=4)
H) Heatmap and normalized density plot of H3K36me3 bound gene bodies.
I) Abundance of alternative bases identified per 10kb bin in H3K36me3 bound CUT&RUN reads.
J) Correlation plots comparing ratio of alternative bases compared to change in H3K36me3 peaks within gene bodies of Setd2wt/wt and Setd2wt/− GCB cells.
Values represent mean ± SEM. P values were calculated using an unpaired (A-D, F) or paired (E) two-tailed t test, paired Wilcoxon (I) or Fisher’s exact test (J); ns, not significant; *, p<0.05; **, p<0.01; ***, p<0.001.
