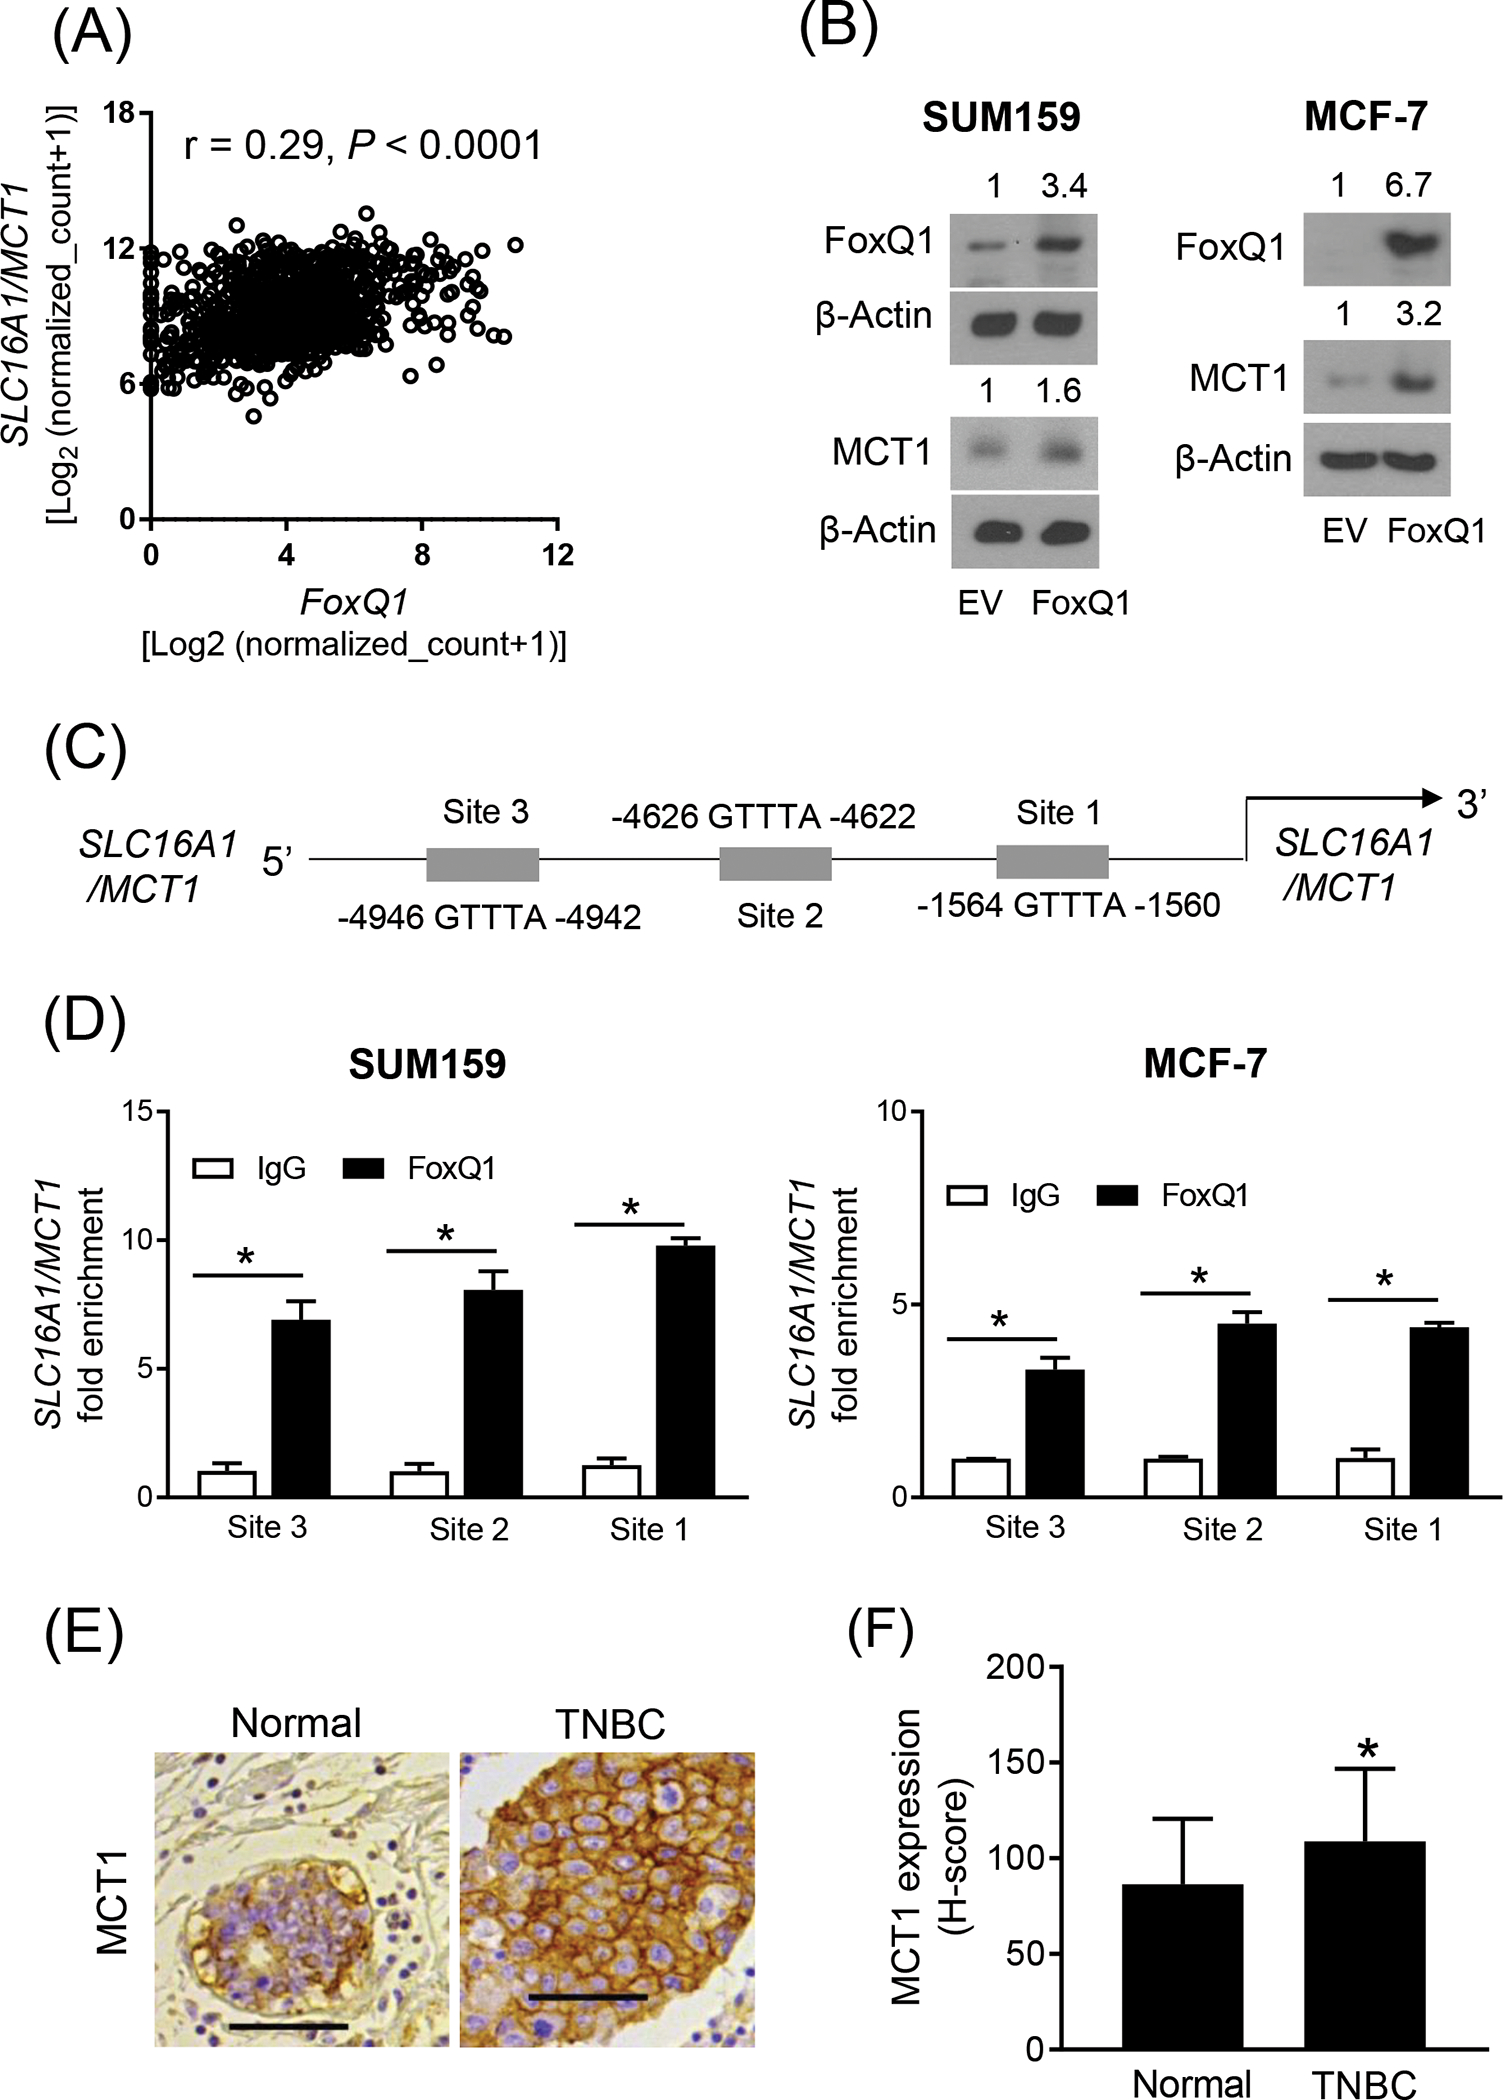
Figure 1.

FoxQ1 is a novel regulator of MCT1. (A) Correlation between FoxQ1 and SLC16A1/MCT1 expression in breast tumors in TCGA (n=1097). Pearson’s test was used to determine the correlation coefficient and statistical significance. (B) Western blot analysis for FoxQ1 and MCT1 proteins using lysates from EV or FoxQ1 overexpressing SUM159 and MCF-7 cells. The numbers on top of the bands represent changes in protein level compared with corresponding EV cells. (C) Schematic diagram of putative FoxQ1 binding sites at the SCL16A1/MCT1 promoter. (D) Bar graphs show recruitment of FoxQ1 at the SLC16A1/MCT1 promoter in SUM159 and MCF-7 cells. Fold enrichment was calculated after normalization to input (mean ± SD; n = 3). *Statistical significance (P < 0.05) was determined by two-sided Student’s t test. (E) representative immunohistochemical image for MCT1 expression in a normal breast section and a TNBC section (20x objective, scale bar = 100 μm). (F) Quantitation of MCT1 protein expression (H-score) in normal breast (n= 50) and TNBC sections (n = 37). Results shown are mean ± SD. *Statistical significance was determined by two-sided Student’s t test. EV, empty vector
