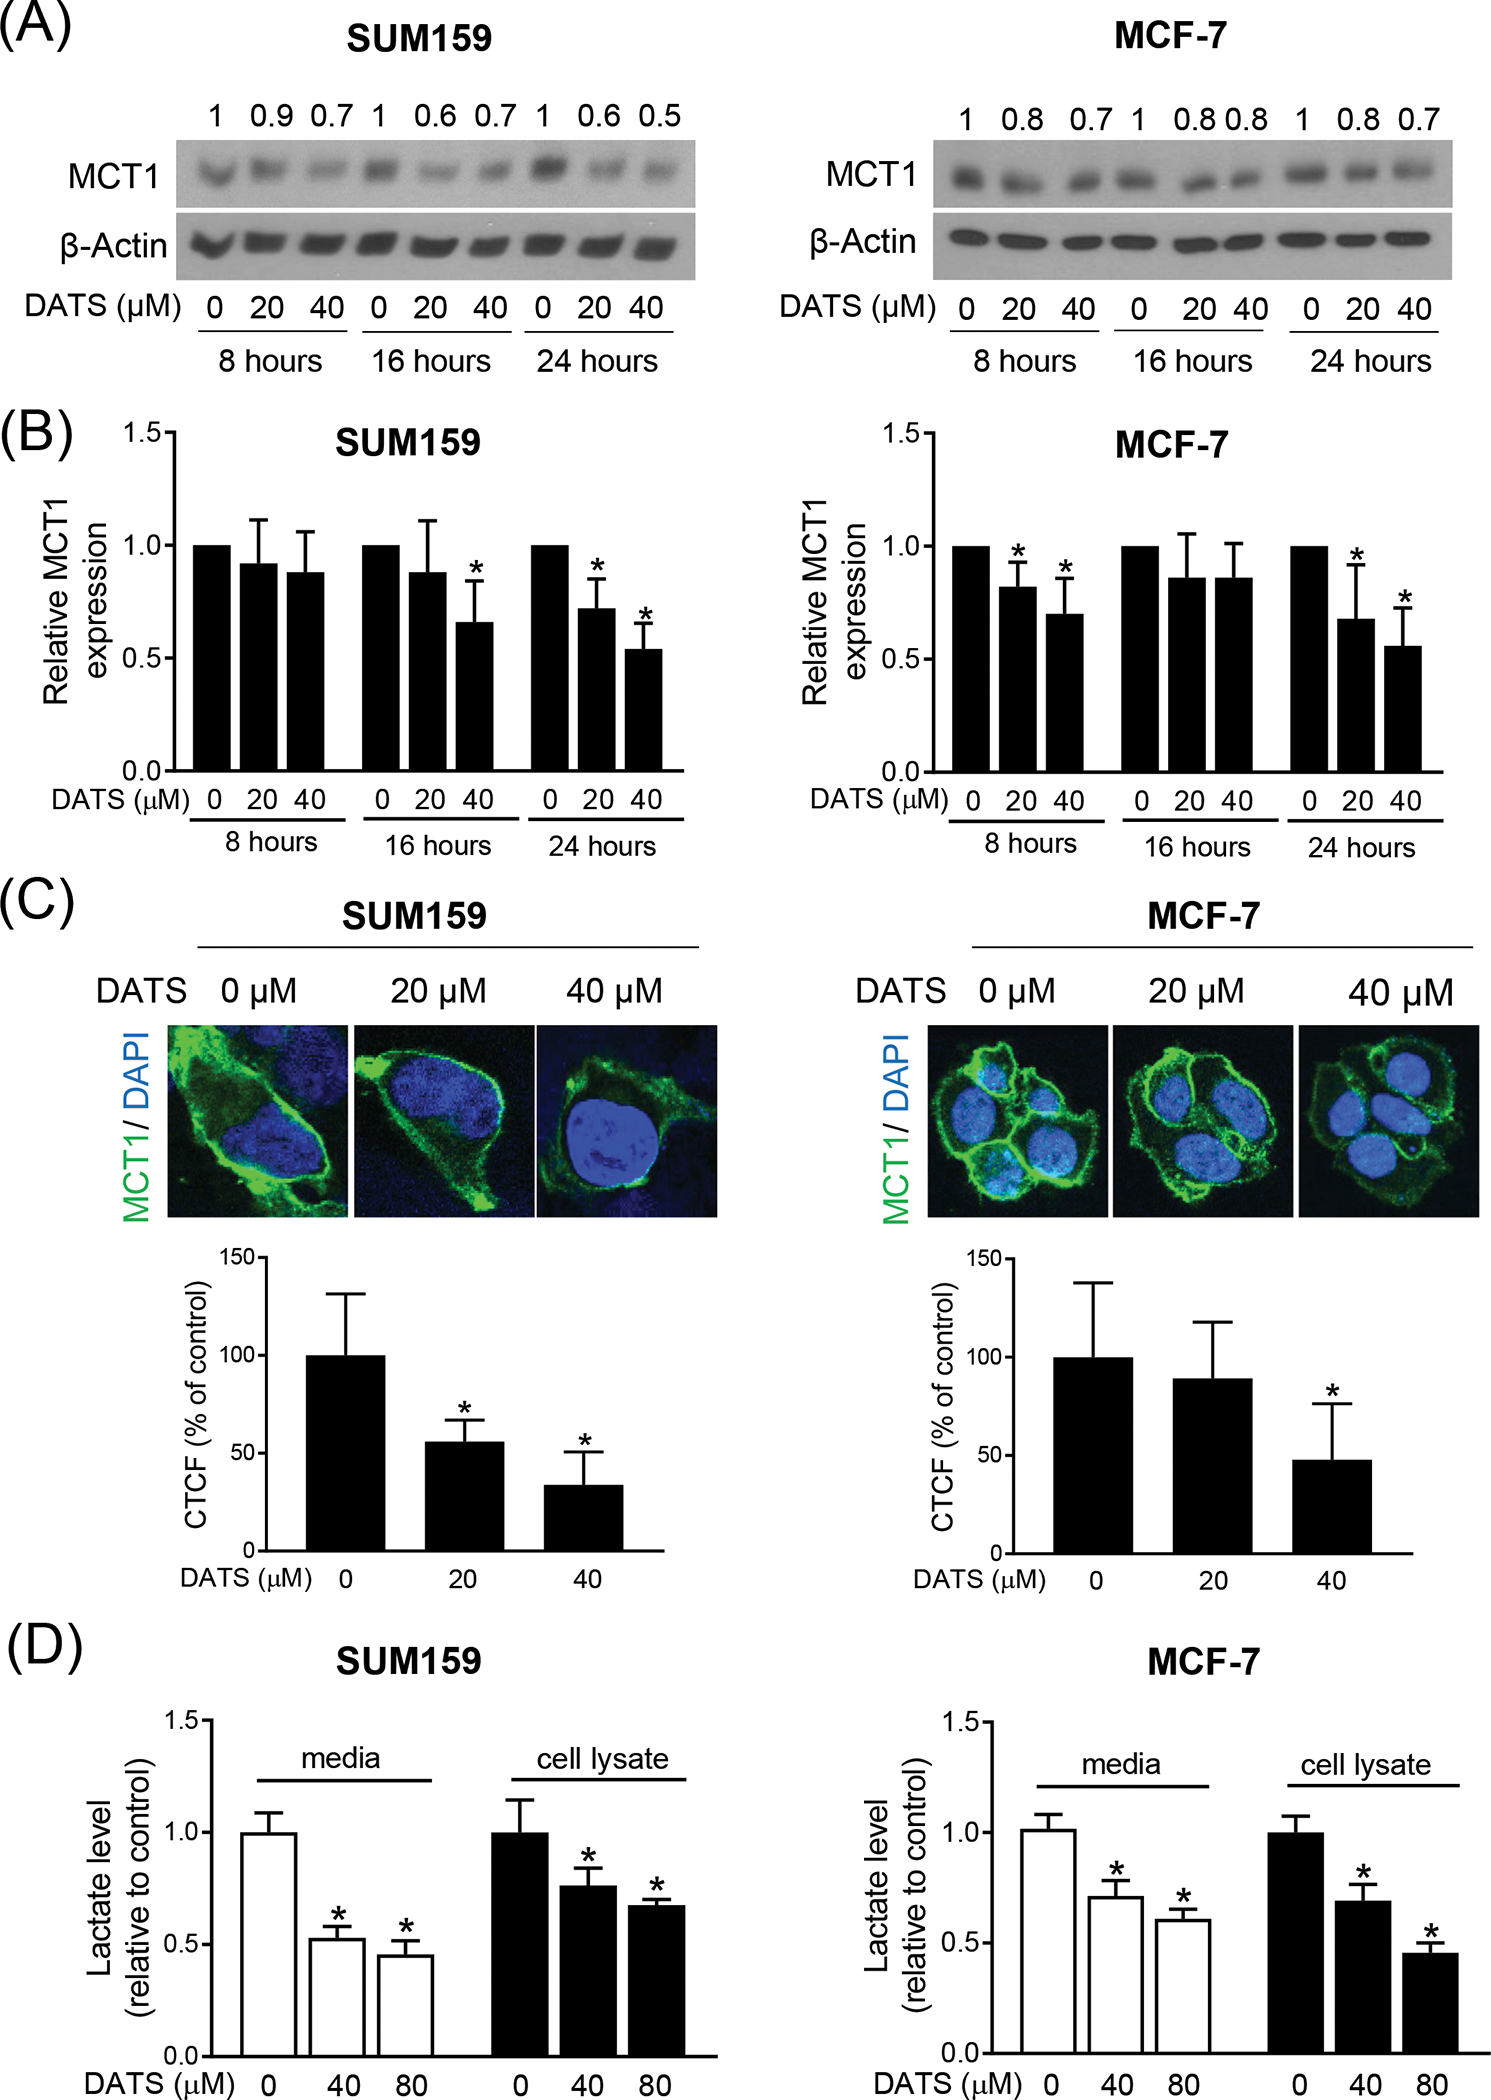
Figure 2.

DATS treatment inhibited expression of MCT1 in Breast Cancer cells. (A) Immunoblotting for MCT1 using cell lysates from SUM159 and MCF-7 cells after treatment with DMSO or desired doses of DATS for the indicated time points. The numbers above the bands represent fold changes in expression relative to the corresponding DMSO-treated control. (B) Quantitation of the MCT1 protein expression from the western blot experiments. The results shown are mean ± SD from five independent experiments. *Significantly different (P < 0.05) compared with DMSO-treated control by one-way ANOVA followed by Dunnett’s test. (C) representative confocal microscopic images (60× oil objective) for MCT1 protein expression (green fluorescence) in SUM159 and MCF-7 cells after 24 h of treatment with DMSO or the indicated dose of DATS. DAPI (blue fluorescence) was used to stain nuclei. Bar graphs show the quantitation of corrected total cell fluorescence (CTCF) for MCT1 protein expression in SUM159 and MCF-7 cells treated with DMSO or the indicated dose of DATS. Results shown are mean ± SD (n = 10–16). *Significantly different (P < 0.05) compared with DMSO-treated control by one-way ANOVA followed by Dunnett’s adjustment. (D) Intracellular or Extracellular lactate levels in SUM159 and MCF-7 cells after treatment with DMSO or the indicated concentrations of DATS for 24 hours. Results were expressed as relative to DMSO-treated control. Results shown are mean ± SD (n = 3). *Significantly different (P < 0.05) compared with DMSO-treated control by one-way ANOVA followed by Dunnett’s adjustment. The results were consistent in two independent experiments.
