Figure 3.

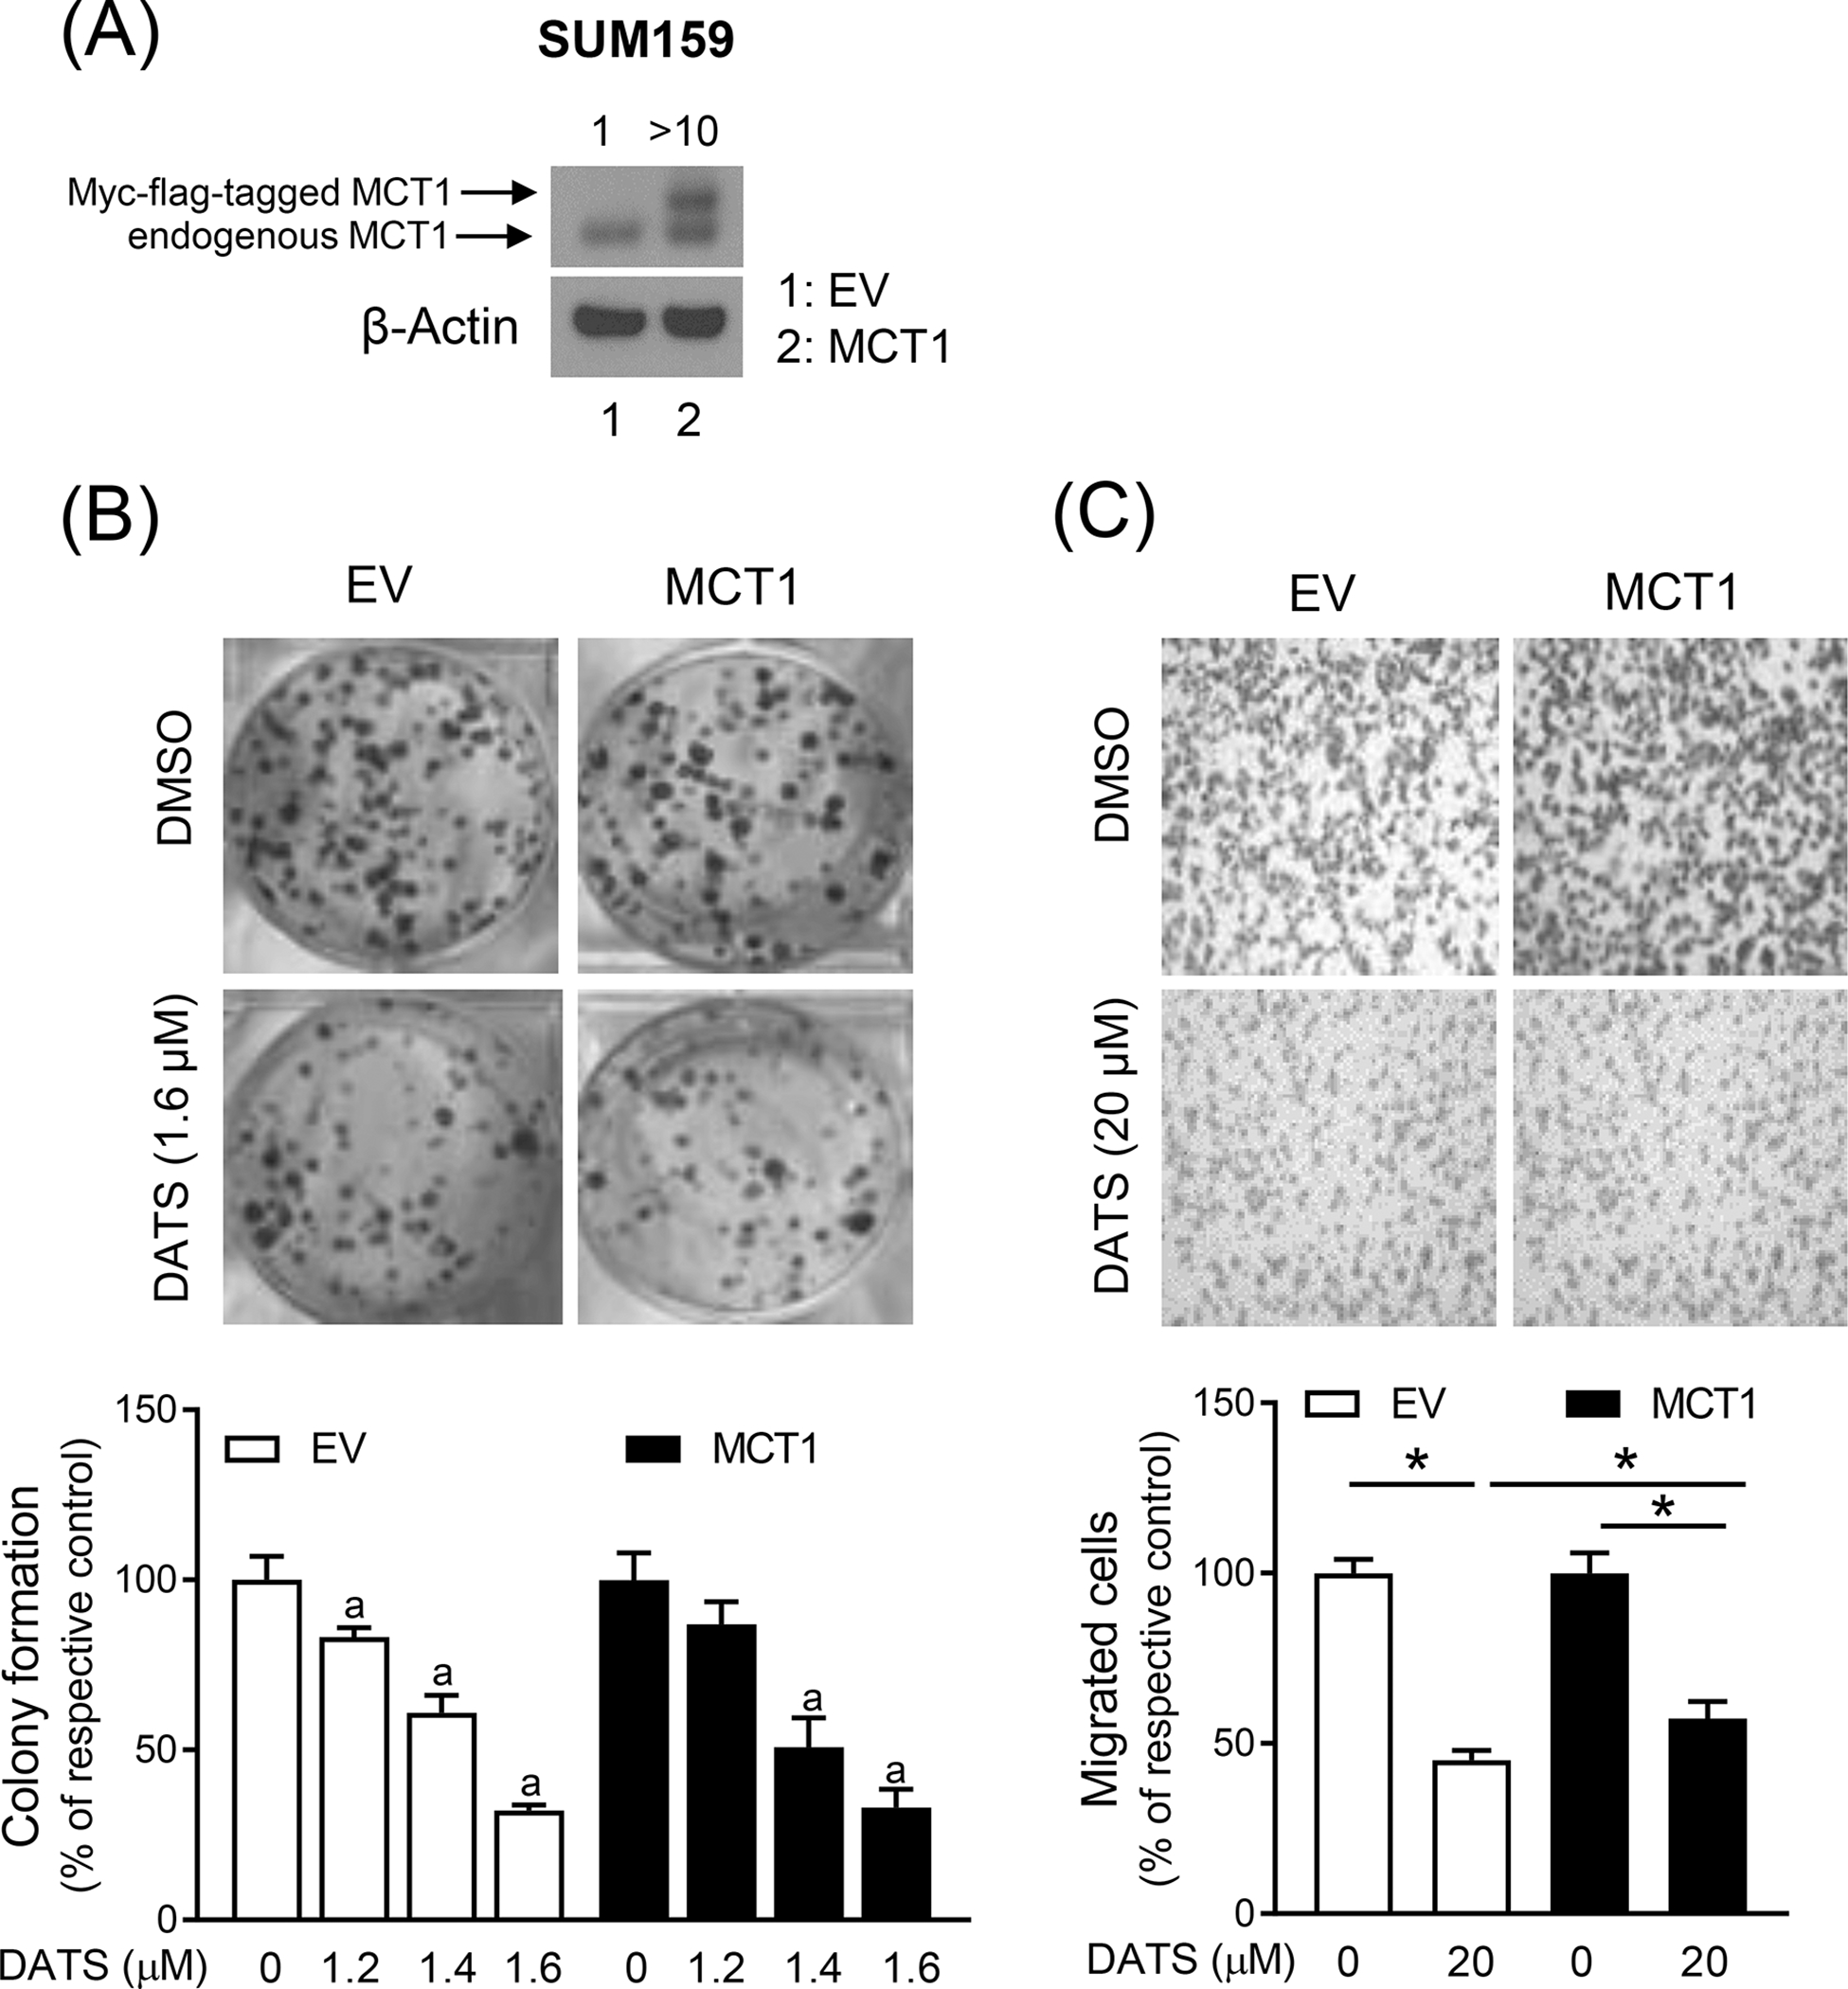
DATS-mediated inhibition of colony formation and migration is not affected by MCT1 overexpression (A) Immunoblotting for MCT1 protein using lysates from SUM159 cells stably transfected with the EV or the same vector encoding for Myc-flag-tagged MCT1 plasmid (MCT1). (B) Representative images of colony formation in EV and MCT1 overexpressing SUM159 cells after treatment with DMSO or DATS for 12 days. The graph shows the percentage of colony formation when compared to respective control. Results shown are mean ± SD (n = 3). Statistically significant (P < 0.05) compared with corresponding DMSO-treated control (a) by one-way ANOVA followed by Bonferroni’s multiple comparisons test. (C) Representative microscopic migration images (Boyden chamber assay) in EV and MCT1 overexpressing SUM159 cells after 24 h treatment with DMSO and DATS (100x magnification). Bar graph shows the percentage of cell migration when compared to respective control. Results shown are mean ± SD (n = 3). *Significantly different (P < 0.05) between the indicated groups by one-way ANOVA followed by Bonferroni’s multiple comparison test. The results were consistent in replicate experiments. EV, empty vector
