Figure 4.

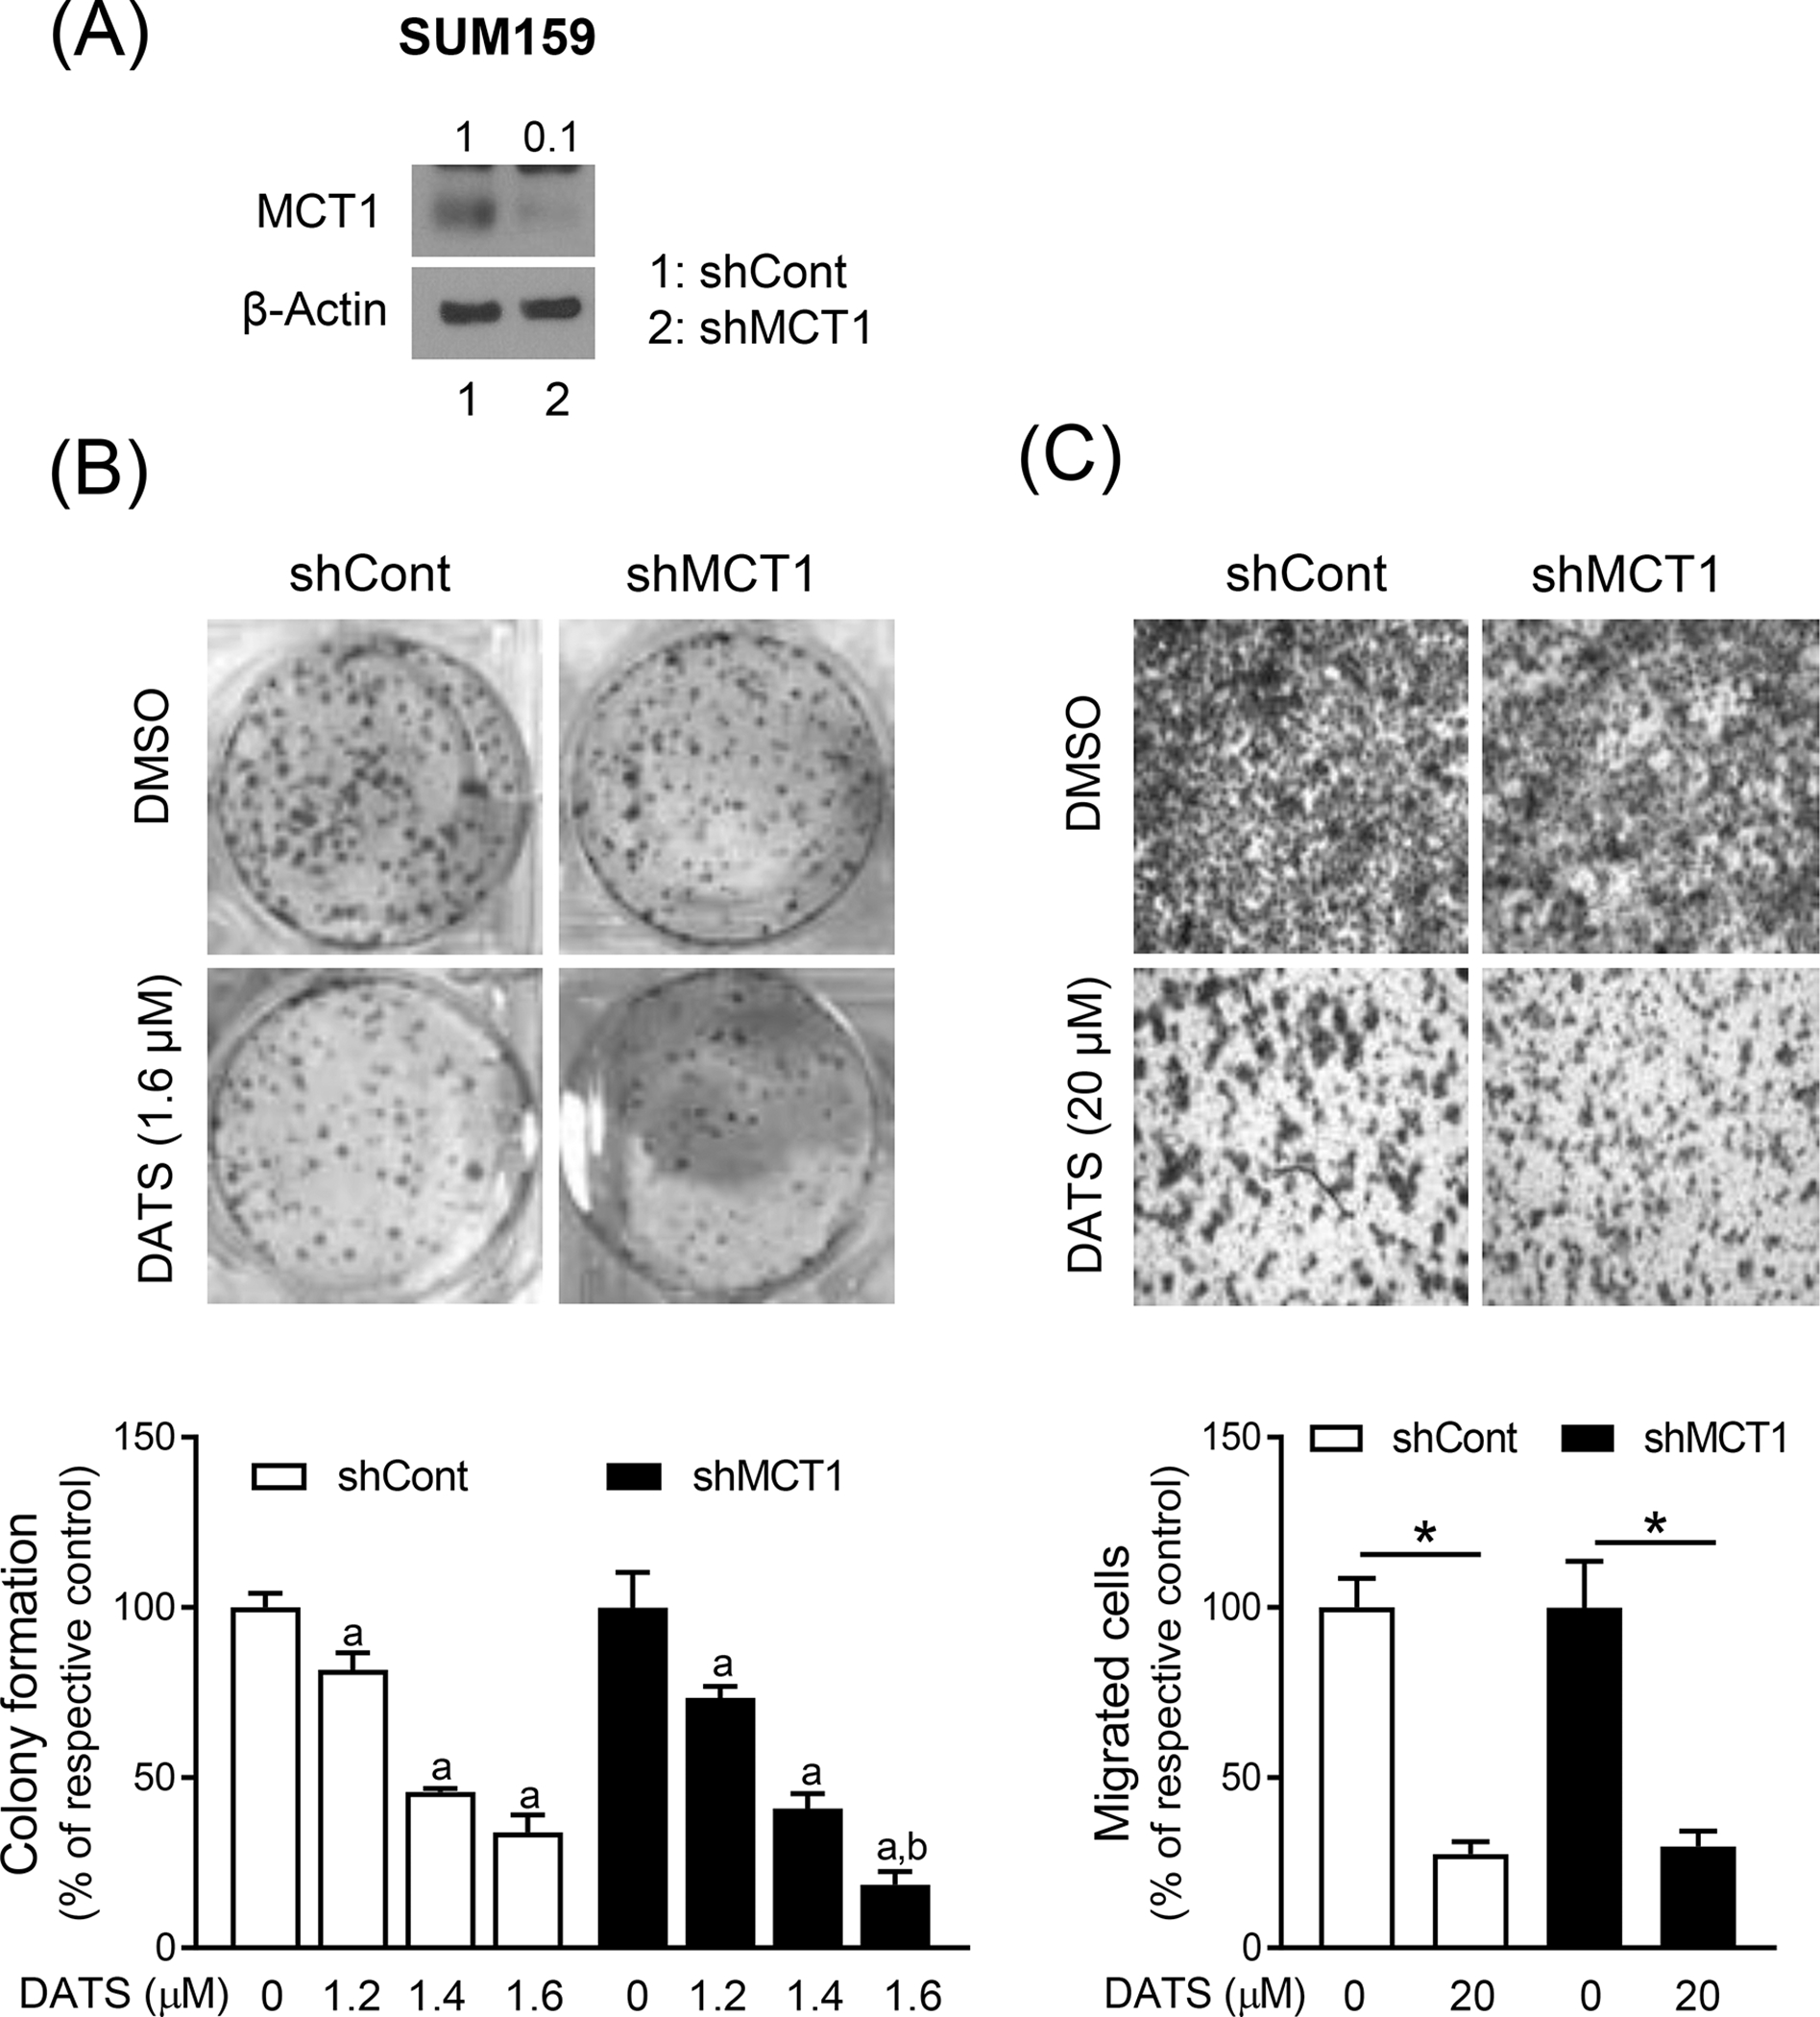
The effect of stable knockdown of MCT1 protein on DATS-mediated inhibition of colony formation and cell migration. (A) Immunoblotting for MCT1 protein using lysates from SUM159 cells stably transfected with a control shRNA (shCont) or a MCT1-targeted shRNA (shMCT1). (B) Representative images of colony formation in SUM159 cells stably transfected with a shCont or a shMCT1 after treatment with DMSO or DATS for 12 days. The graph shows the percentage of colony formation when compared to respective control. Results shown are mean ± SD (n = 3). Statistically significant (P < 0.05) compared with corresponding DMSO-treated control (a) or between shCont and shMCT1 transfected cells at the same dose of DATS (b) by one-way ANOVA followed by Bonferroni’s multiple comparisons test. (C) Representative microscopic migration images (Boyden chamber assay) in SUM159 cells stably transfected with a shCont and a shMCT1 after 24 h treatment with DMSO or DATS (100x magnification). Bar graph shows the percentage of cell migration when compared to respective control. Results shown are mean ± SD (n = 3). *Significantly different (P < 0.05) between the indicated groups by one-way ANOVA followed by Bonferroni’s multiple comparison test. Comparable results were observed in two independent experiments.
