Figure 5.

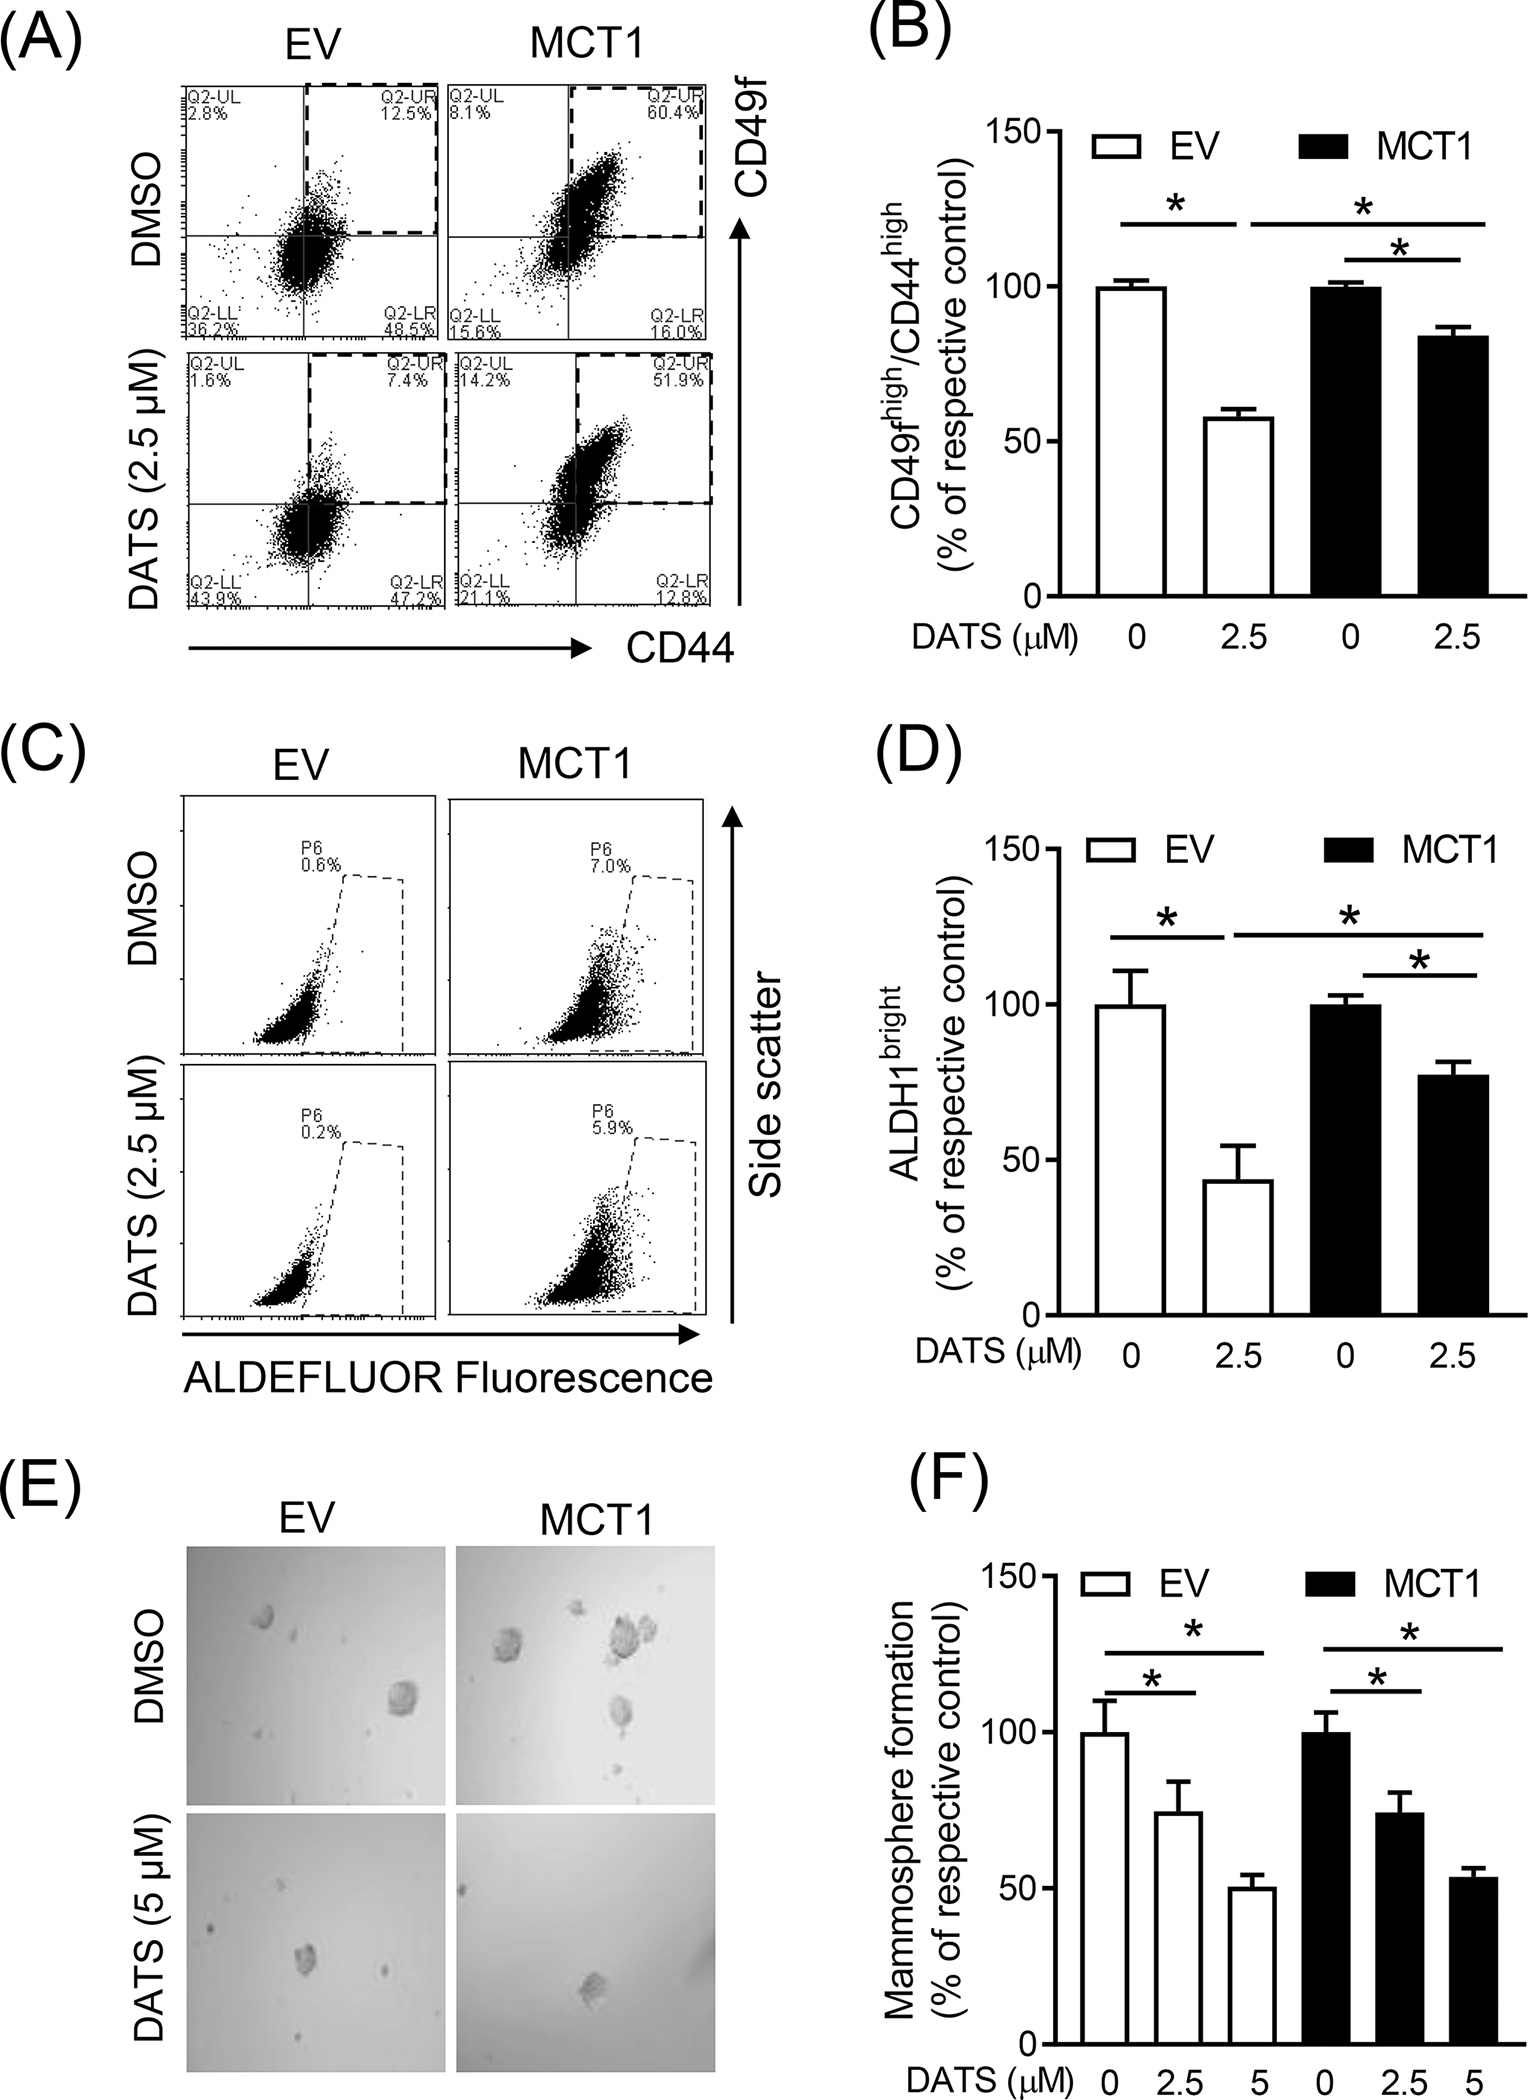
The role of MCT1 overexpression in DATS-mediated inhibition of bCSC (A) Representative flow histograms for the CD49fhigh/CD44high population in EV and MCT1 overexpressing SUM159 cells after treatment with DMSO or DATS (2.5 μM) for 72 hours. (B) Bar graph shows the percentage of the CD49fhigh/CD44high population when compared to respective control. (mean ± S.D., n = 3) (C) Representative flow histograms for ALDH1 activity in EV and MCT1 overexpressing SUM159 cells after 72-h treatment with DMSO or DATS (2.5 μM). (D) The graph shows the quantitation of ALDH1 activity when compared to respective control (mean ± S.D., n = 3). (E) Representative mammosphere images after 7 days of treatment with DMSO or DATS (5 μM) in EV and MCT1 overexpressing SUM159 (100x magnification). (F) Quantitation of mammosphere formation when compared to respective to control (mean ± S.D., n = 3). * P < 0.05 between the indicated groups by one-way ANOVA followed by Bonferroni’s multiple comparisons test. Each experiment was repeated at least twice with comparable results. EV, empty vector
