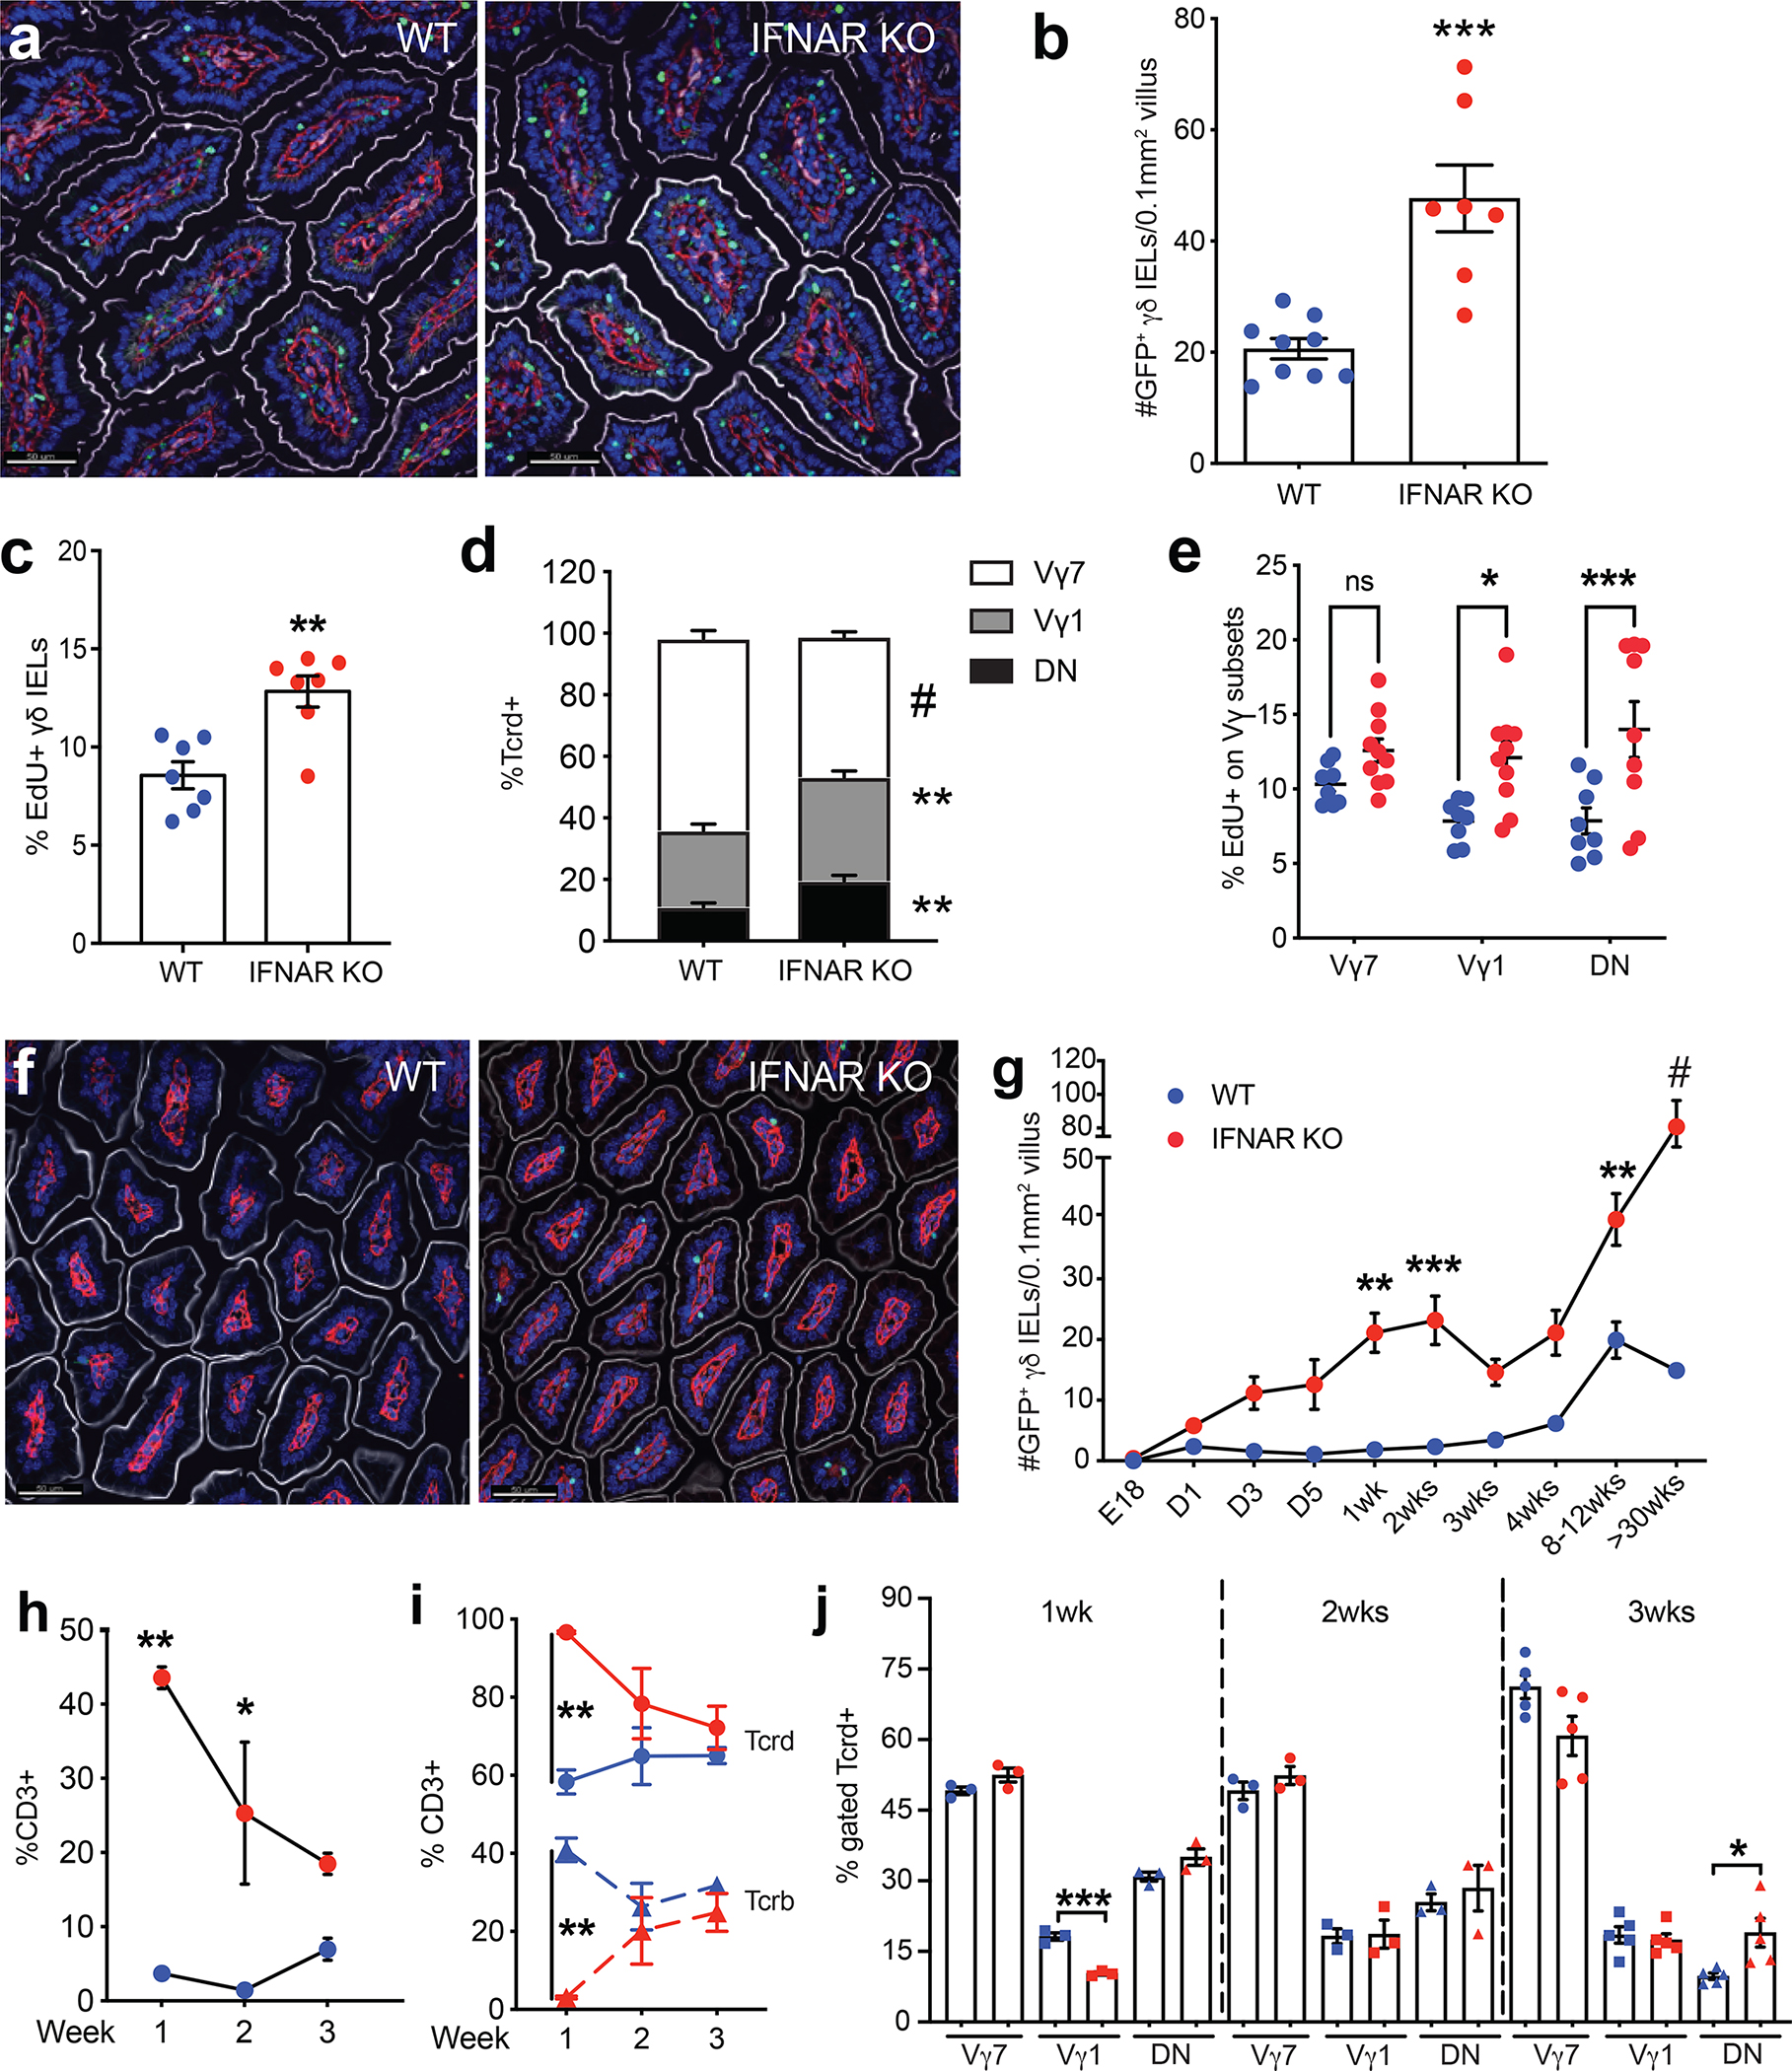
Figure 1. IFNAR-deficient mice exhibit a γδ IEL hyperproliferative phenotype and skewed Vγ composition early in life.

a Immunofluorescent micrographs of jejunum from TcrdEGFP WT and IFNAR KO mice. Scale bar = 50μm. Nuclei, blue; laminin, red; γδ T cell, green; F-actin, white. b Quantification of jejunal GFP+ γδ T cells. c Percentage of EdU+ γδ IELs and d frequency of SI Vγ IEL subsets in WT and IFNAR KO mice (gated on GFP). e Percentage of EdU+ cells (gated on individual Vγ subsets). f Immunofluorescent micrographs of jejunum from 1-week old TcrdEGFP WT and IFNAR KO mice. Scale bar = 50μm. g Number of GFP+ γδ T cells in the SI of WT or IFNAR KO mice at various ages, n=4–10. Frequency of h CD3+ cells (gated on live cells), i Tcrd+ and Tcrb+ IELs (gated on CD3) and j Vγ subsets (gated on GFP) in WT and IFNAR KO postnatal mice, n=3–6. Data represent mean (±SEM) and are from at least two independent experiments. Each data point represents an individual mouse. Statistical analysis: b,c,j: unpaired t-test; d,e,g,h: two-way ANOVA with Sidak’s post hoc test; i: two-way ANOVA with Tukey’s post hoc test. *P<0.05, **P<0.01, *** P<0.001, # P<0.0001. ns, not significant.
