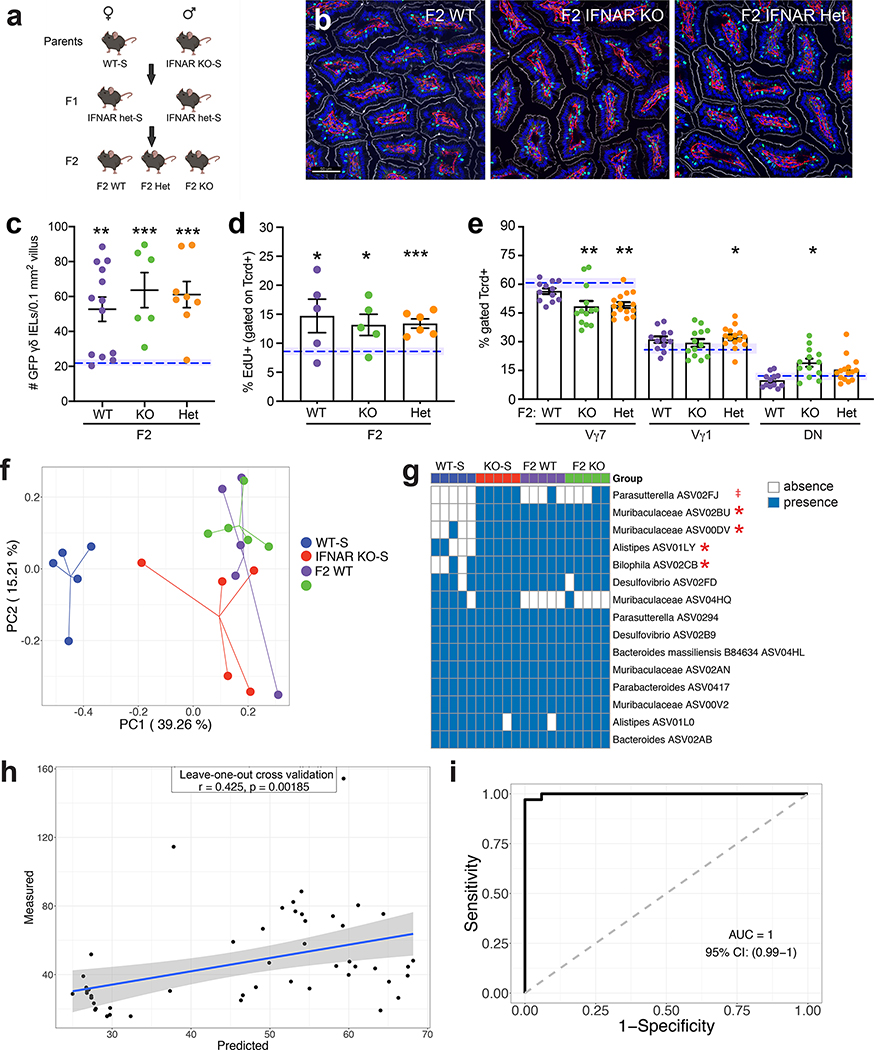
Figure 3. The γδ IEL hyperproliferative phenotype is transmitted vertically independently of genotype.
a Breeding strategy used to generate F2 WT and IFNAR KO littermates. b Representative images and c morphometric analysis of GFP+ γδ T cells in the jejunum of adult F2 littermates. Scale bar = 50μm. n=6–13 mice in three independent experiments. d Percentage of EdU+ γδ IELs and e proportion of Vγ IEL subsets in adult F2 littermates. Dashed lines indicate separately housed WT-S mean values, shaded area (±SEM). f Principal coordinates analysis of 16S rRNA sequencing of fecal microbiota from WT-S, IFNAR KO-S and F2 WT and IFNAR KO littermates. g Occurrence heatmap of the 15 ASVs identified in the horizontal transfer dataset. Blue and white show the presence or absence of ASVs, respectively. h and i Associations between the 5 ASVs (highlighted in g) and the γδ IEL hyperproliferative phenotype. Data represent mean (±SEM) from two independent experiments. Each data point represents an individual mouse. Statistical analysis: c,d: unpaired t test compared to separately housed WT-S values; e: one-way ANOVA with Dunnett’s post hoc test; g: Fisher’s exact test was performed to compared prevalence of ASVs between WT-S and the combination of the other 3 groups. h: Random Forest model with leave-one-out cross-validation was applied to use the ASVs abundance to regress the γδ IEL cell number or i: to classify mice with or without γδ IEL hyperproliferative phenotype. Pearson correlation was used to compare the predicted and measured values for regression model. (AUC) area under the curve of ROC (Receiver Operating Characteristics) was used to assess the classification model. ‡P<0.1 *P<0.05, **P<0.01, *** P<0.001.

