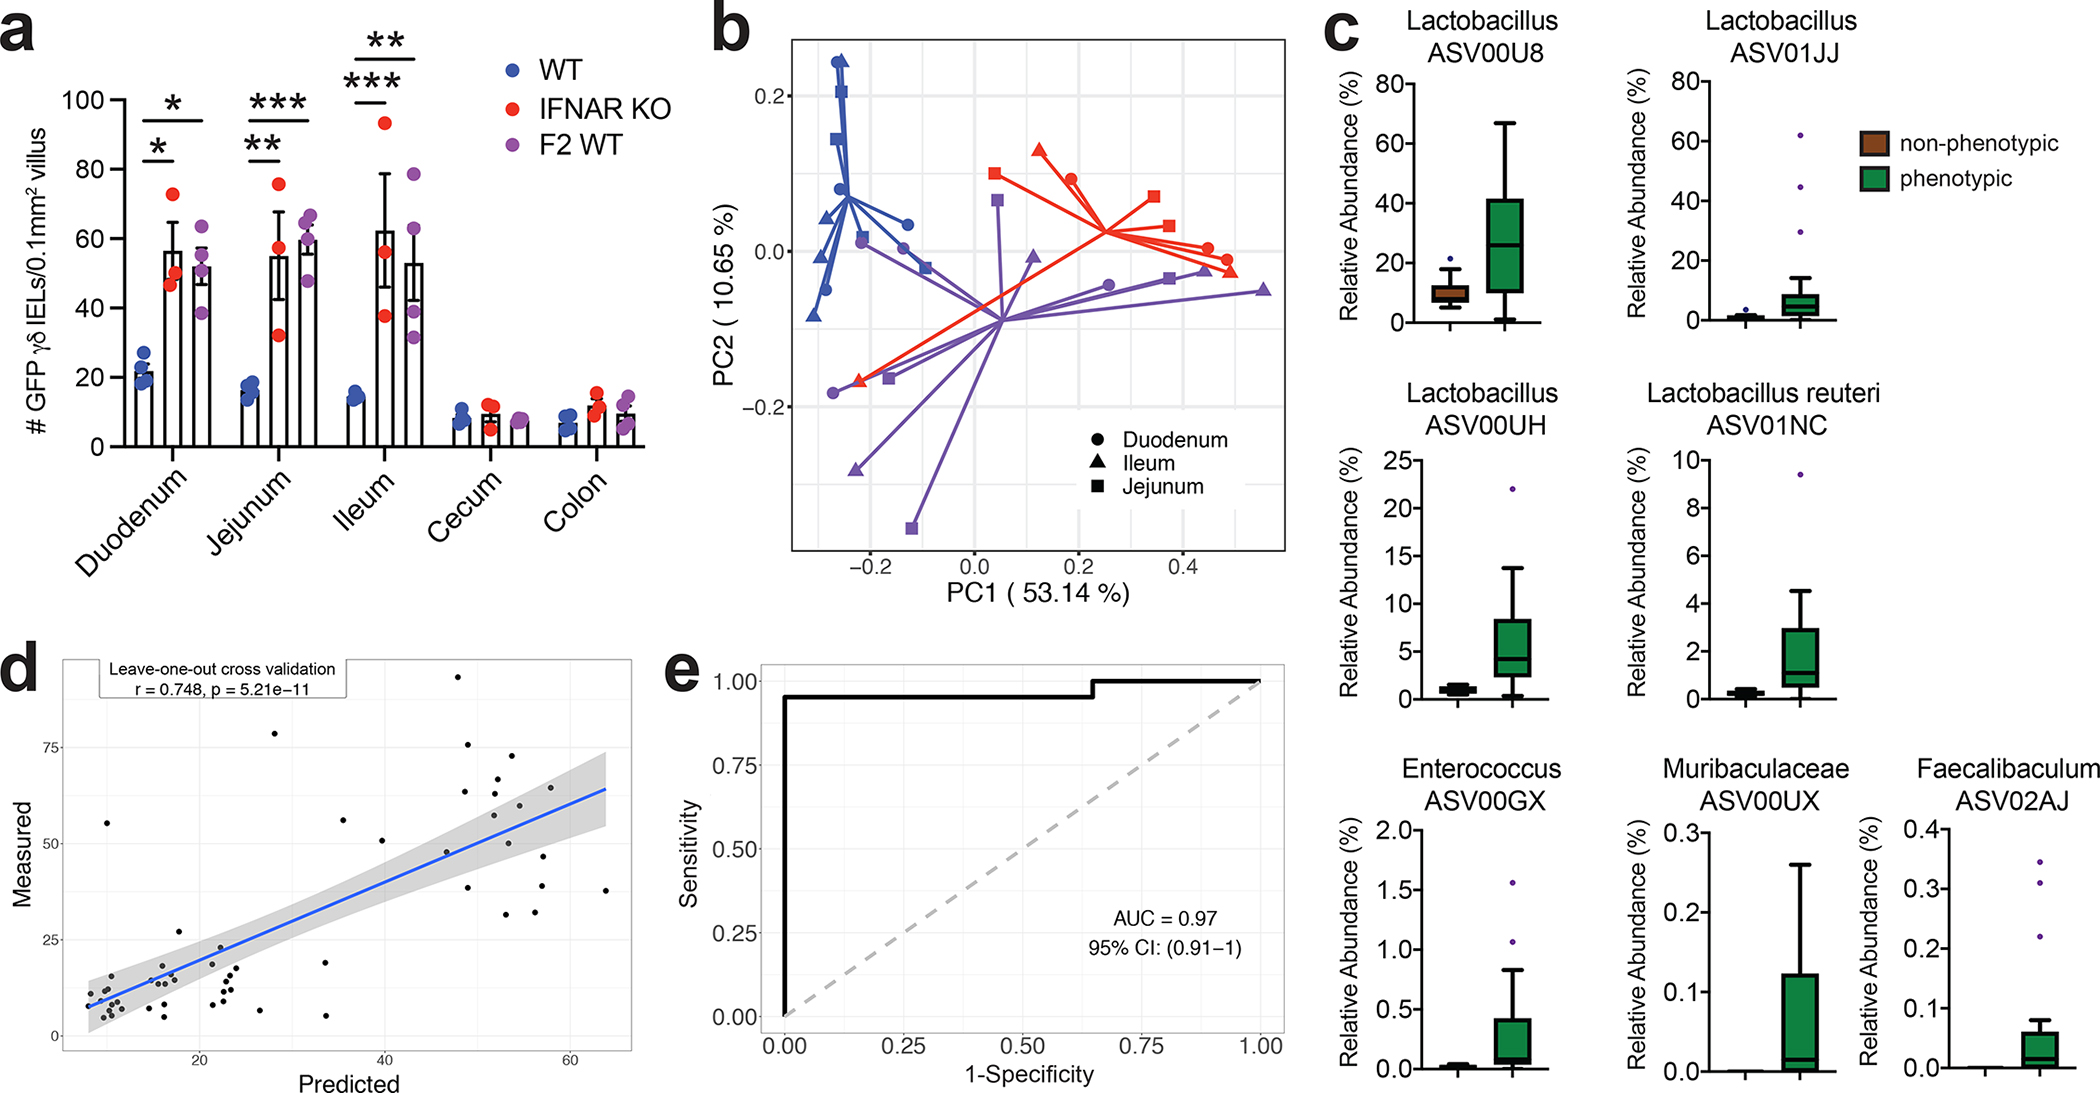
Figure 4. Small intestinal microbiota signature is associated with the local expansion of the γδ IEL compartment.

a Morphometric analysis of the number of GFP+ γδ T cells in untreated WT-S, IFNAR KO-S or F2 WT mice. b Principal coordinates analysis of 16S rRNA sequencing of SI luminal microbiota from WT-S, IFNAR KO-S and F2 WT mice. Bray Curtis distance was applied. c Seven ASVs in the SI were enriched in the mice with γδ IEL hyperproliferative phenotype. d and e Associations between the 7 ASVs in the SI enriched by the mice with γδ IEL hyperproliferative phenotype. Statistical analysis: a: one-way ANOVA with Tukey’s post hoc test; c: MaAsLin2 was applied to explore the differential ASVs in SI samples between mice with (IFNAR KO-S and F2 WT) and without the γδ IEL hyperproliferative phenotype (WT-S). BH-adjusted p values < 0.05 considered as significant. Boxes show the medians and the interquartile ranges (IQRs), the whiskers denote the lowest and highest values that were within 1.5 times the IQR from the first and third quartiles, and outliers are shown as individual points; d: Random Forest model with leave-one-out cross-validation was applied to use the ASVs abundance in the intestine to regress the intestinal γδ IEL cell number or e: to classify intestinal segments based on the γδ IEL hyperproliferative phenotype. Pearson correlation was used to compare the predicted and measured values. *P<0.05, **P<0.01, *** P<0.001.
