
Figure 5. Combining the fecal and small intestinal microbiota signatures accurately predicts the γδ IEL hyperproliferative phenotype.
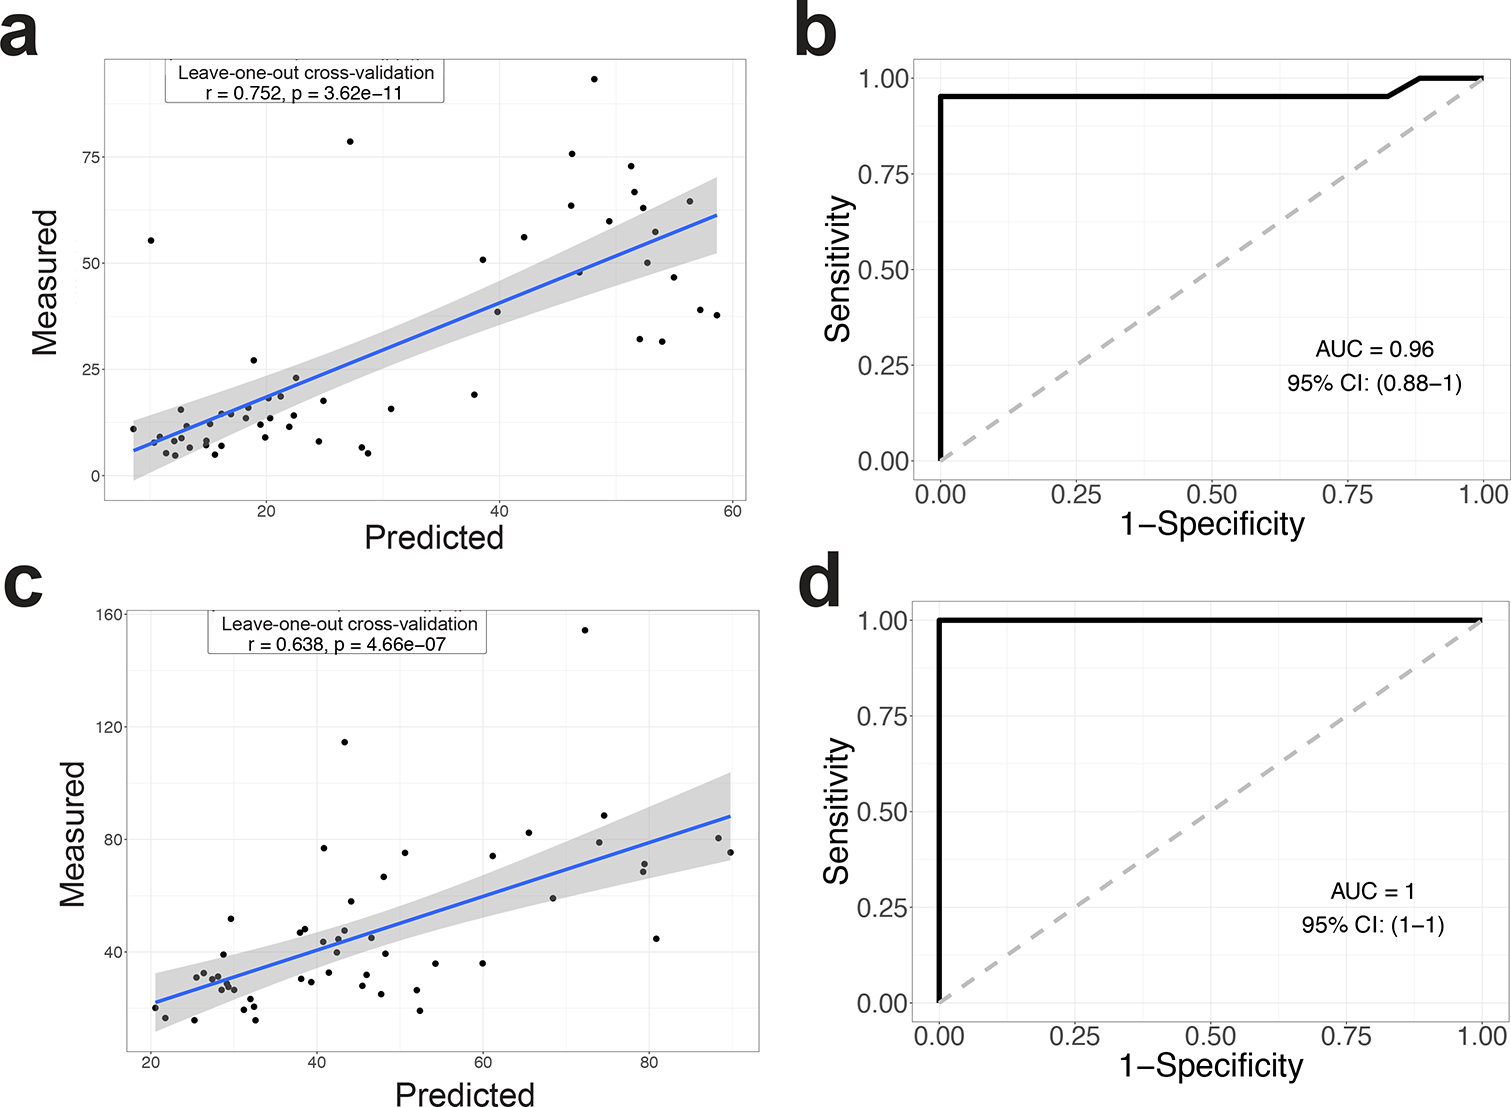
Random Forest model with leave-one-out cross-validation was applied to use the 12 ASVs abundance in the intestine (a) and feces (c) to regress the intestinal γδ IEL cell number. b Random Forest model with leave-one-out cross-validation was applied to use the 12 ASVs abundance in the intestine (b) and feces (d) to classify intestinal segments with or without the γδ IEL hyperproliferative phenotype. Pearson correlation was used to compare the predicted and measured values for regression model. (AUC) area under the curve of ROC (Receiver Operating Characteristics) was used to assess the classification model.