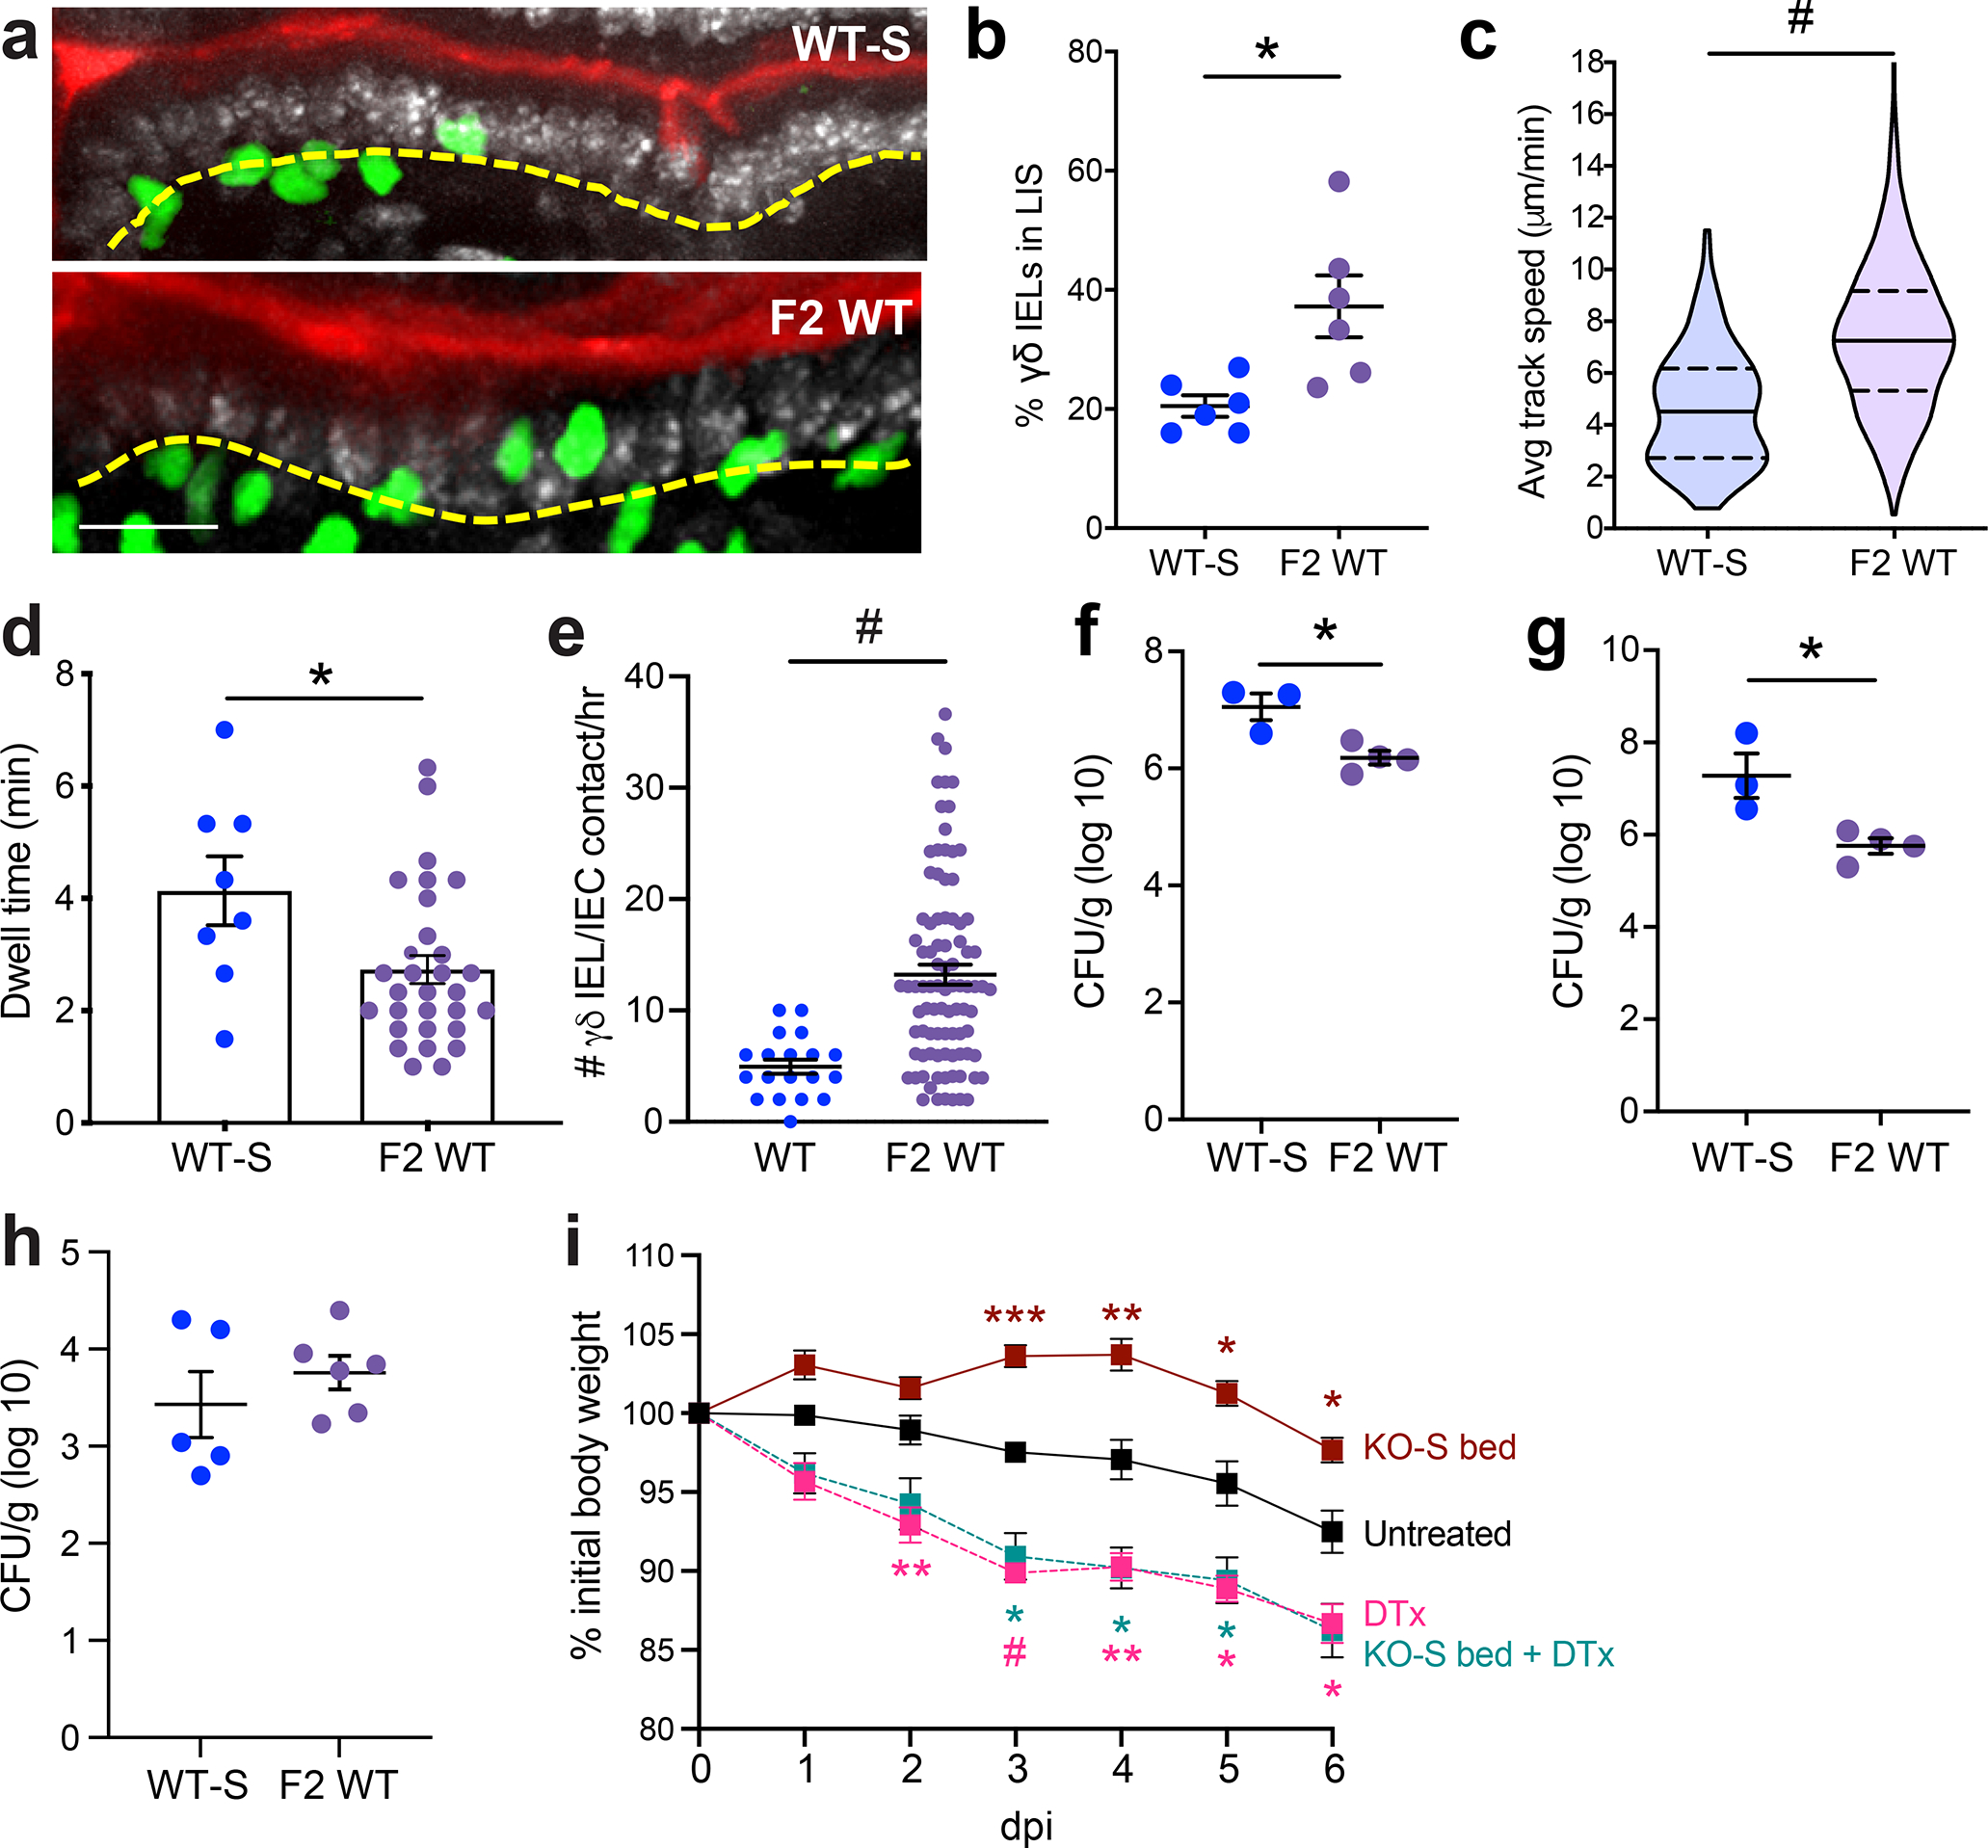
Figure 6. γδ IEL surveillance behavior is enhanced in WT mice exhibiting the hyperproliferative phenotype and confers protection against enteric infection.

a Maximum projection images taken from intravital microscopy of γδ IELs (green) within the jejunal epithelium of WT-S and F2 WT mice. Scale bar = 30μm. Nuclei, white; lumen, red. Yellow dashed line approximates the basement membrane. b Frequency of γδ IELs in the lateral intercellular space (LIS), c average track speed, d dwell time and e γδ IEL/IEC contacts/hr. WT-S and F2 WT mice were infected orally with Salmonella Typhimurium and CFU were measured at 6 dpi in f spleen and g liver homogenates. h CFU from ileal homogenate 24 h post-infection i Weight loss of TcrdGDL mice receiving IFNAR KO-S bedding and/or DTx in response to Salmonella infection. Each data point represents an individual mouse, except c,d,e in which each data point represents an individual track, γδ IEL or IEC, respectively, and i in which the data is grouped. Data represent mean (±SEM). Statistical analysis: a-h: unpaired t-test; i: two-way ANOVA with Tukey’s post hoc test. *P<0.05, **P<0.01, *** P<0.001, # P<0.0001.
