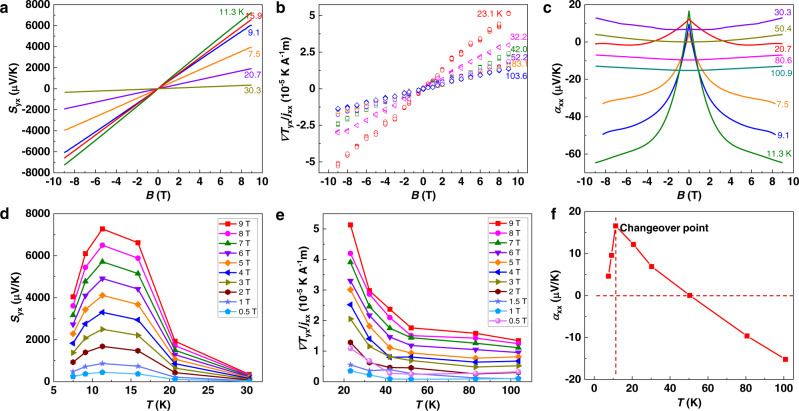
Fig. 2. Nernst, Ettingshausen, and Seebeck effect in WTe2.
a Nernst signal from 7.5 K to 30.3 K. b Ettingshausen signal from 23.1 K to 103.6 K. c Seebeck coefficient from 7.5 K to 100.9 K. d Nernst signal as a function of temperature. e Ettingshausen signal as a function of temperature. f Temperature-dependent Seebeck coefficient at 0 T of a WTe2 single crystal. Both the Nernst and Ettingshausen effects show large, non-saturating signals up to 9 T. The maximum Nernst effect is observed in the range of 10–15 K, and the maximum Ettingshausen effect observed in the present work was at 23.1 K, which is the lower temperature limit of our measurements.

