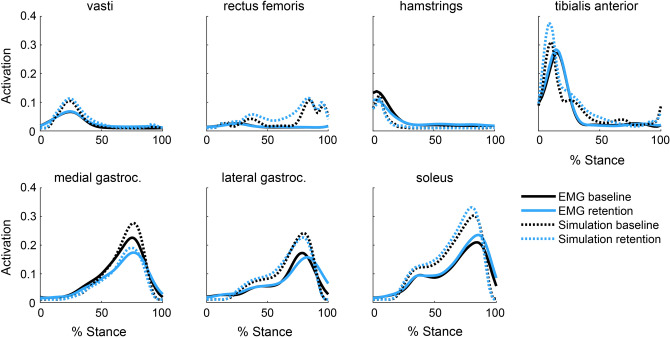
Figure 5.
Simulated and measured muscle activation. Electromyography (EMG) linear envelopes averaged across all participants (n = 10) with a 40 ms electromechanical delay are compared to simulated muscle activations for the baseline and retention trials. Despite magnitude differences between EMG and simulated activations of the gastrocnemius and soleus, the relative changes between trials are consistent, indicating that our EMG-informed static optimization technique captured the changes in ankle plantarflexor muscle activity measured with EMG. The activations of the muscles in the top row were not informed by EMG in the simulation. The shape, timing, and between-trial changes in simulated activation matched EMG for these muscles, with the exception of the rectus femoris.

