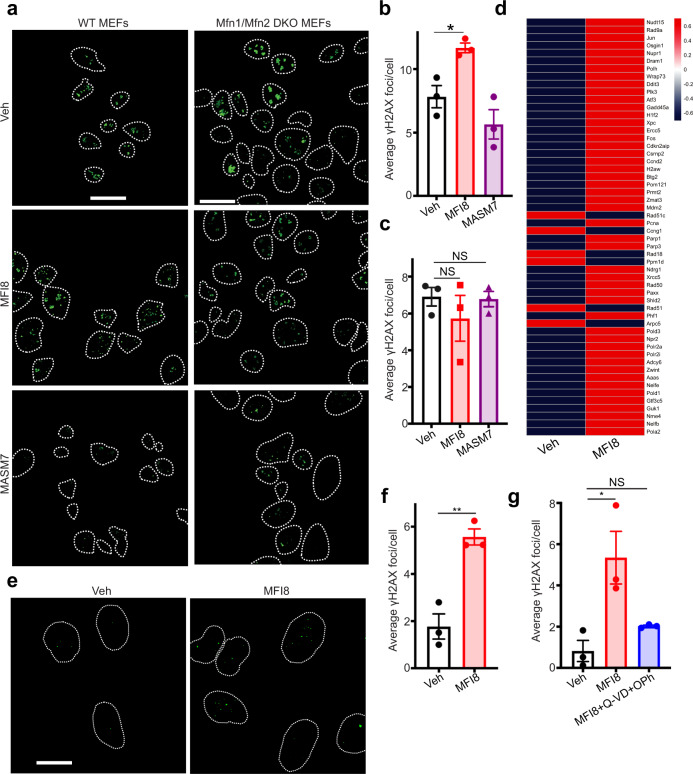
Fig. 6. MFI8 induces DNA damage.
a MEFs and Mfn1/Mfn2 DKO MEFs were immunostained for γH2AX. Cells were treated with MFI8 (20 μM, 6 h) or MASM7 (1 μM, 6 h). Scale bar 20 μm. b Quantification of γH2AX foci of WT MEFS (a). Error bars represent mean ± SEM of three independent biological replicates. c Quantification of γH2AX foci of Mfn1/Mfn2 DKO MEFs (a). Error bars represent mean ± SEM of three independent biological replicates. d Relative variance-stabilized expression levels of genes that are involved in DNA damage response. e U2OS cells were immunostained for γH2AX. Cells were treated with MFI8 (20 μM, 6 h). Scale bar 20 μm. f Quantification of γH2AX foci of (e). Error bars represent mean ± SEM of three independent biological replicates. g Quantification of γH2AX foci from U2OS cells treated with MFI8 or the combination of MFI8 with Q-VD-OPh. Error bars represent mean ± SEM of three independent biological replicates. Statistics were obtained using two-tailed unpaired t-test for panel (f) or one way ANOVA for panels (b, c, g): *p < 0.05, **p < 0.01, ***p < 0.001, ****p < 0.0001. Source data are provided as a Source Data file.

