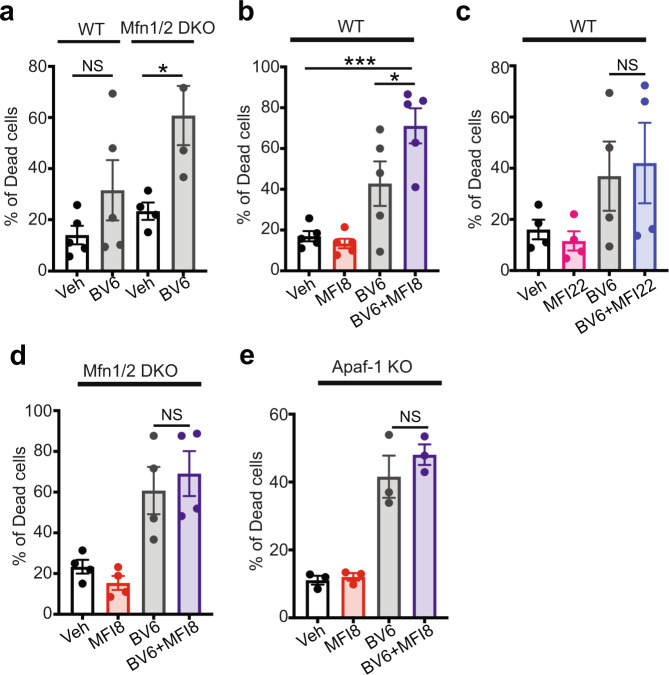
Fig. 7. MFI8 induces cell death in combination with BV6 SMAC mimetic.
Evaluation of dead cells using Annexin V/PI staining as readouts via flow cytometry. Cells that were positive to Annexin V, PI, or both, were considered as dead. Cells were treated with MFI8 or MFI22 (20 μM, 6 h) and BV6 (20 μM, 6 h). a Percentage of dead cells in WT and Mfn1/Mfn2 DKO MEFs upon treatment with BV6. Data represent mean ± SEM from n = 5 independent experiments for WT MEFs and n = 4 independent experiments for Mfn1/Mfn2 DKO MEFs. b Percentage of dead cells in WT MEFs upon treatment with BV6, MFI8, or the combination of both. Data represent mean ± SEM from n = 5 independent experiments. c Percentage of dead cells in WT MEFs upon treatment with BV6, MFI22, or the combination of both. Data represent mean ± SEM from n = 4 independent experiments. d Percentage of dead cells in Mfn1/Mfn2 DKO MEFs upon treatment with BV6, MFI8, or the combination of both. Data represent mean ± SEM from n = 4 independent experiments. e Percentage of dead cells in Apaf-1 KO MEFs upon treatment with BV6, MFI8, or the combination of both. Data represent mean ± SEM from n = 3 independent experiments. Statistics were obtained using one way ANOVA for panels (a, b): *p < 0.05, **p < 0.01, ***p < 0.001, ****p < 0.0001. Source data are provided as a Source Data file.

