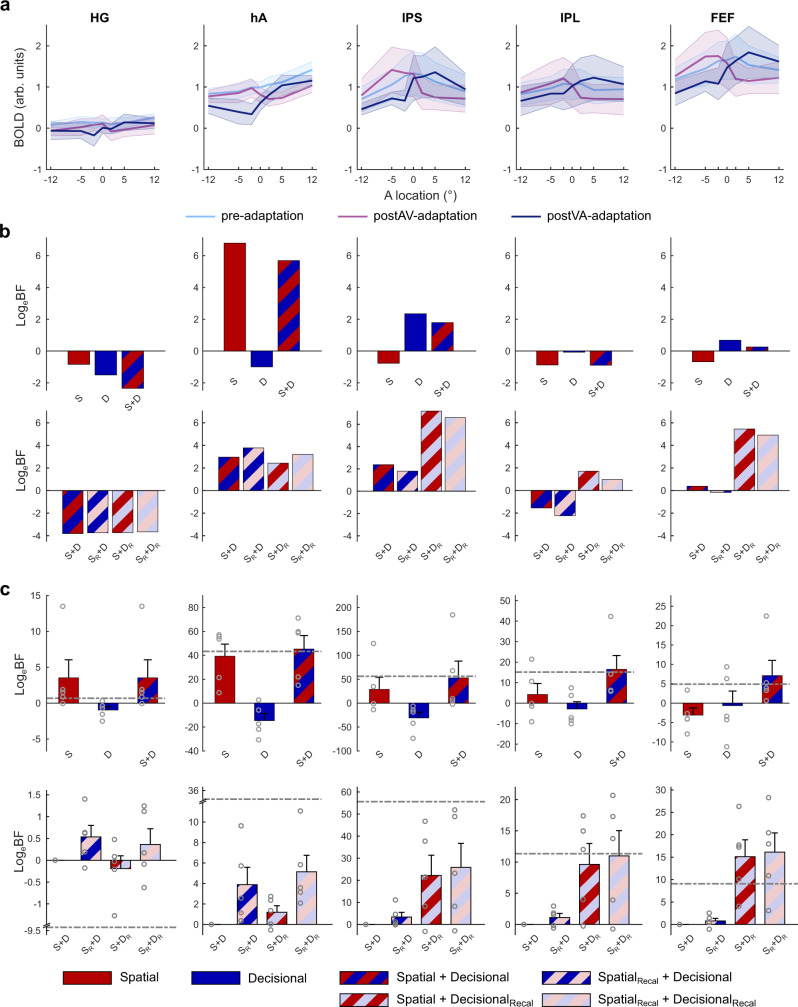
Fig. 5. fMRI results: regional BOLD-response and pattern component modelling (PCM).
a Across-subjects’ mean (n = 5 subjects) positive BOLD-responses shown as a function of spatial location in pre-, postVA- and postAV-adaptation phases across ROIs. The shaded areas indicate SEM. b Results of the linear mixed-effects analysis of regional mean BOLD-response across ROIs: Loge-Bayes factors (LogeBF) for a specific target model as indicated by the capital letter relative to the null model, which includes only the constant term (see Supplementary Methods: Plotting of regional mean BOLD-responses). Top row: The spatial, decisional, and spatial + decisional uncertainty models without recalibration. Bottom row: The models factorially manipulate whether the spatial and/or decisional component include recalibration. c PCM results—Spatial and/or decisional uncertainty models as predictors for fine-grained BOLD-response patterns across ROIs. Across-subjects’ mean LogeBFs (±SEM, n = 5 subjects) and individual data points (circular markers) for each predictor model. Top row: The spatial, decisional,- and spatial + decisional uncertainty models without recalibration relative to a null model that allows for no similarity between activity patterns. Bottom row: The models factorially manipulate whether the spatial and/or decisional component accounts for recalibration. Loge-Bayes factors are relative to the spatial + decisional uncertainty model (without recalibration) as the null model. Dash-dotted grey lines indicate the relative LogeBF for the fully flexible models as noise ceiling estimated separately for the top and bottom row model comparisons (for details, see Methods). S = spatial model without recalibration, D = decisional uncertainty model without recalibration, SR = spatial model with recalibration, DR = decisional uncertainty model with recalibration32. Source data are provided as a Source Data file.

