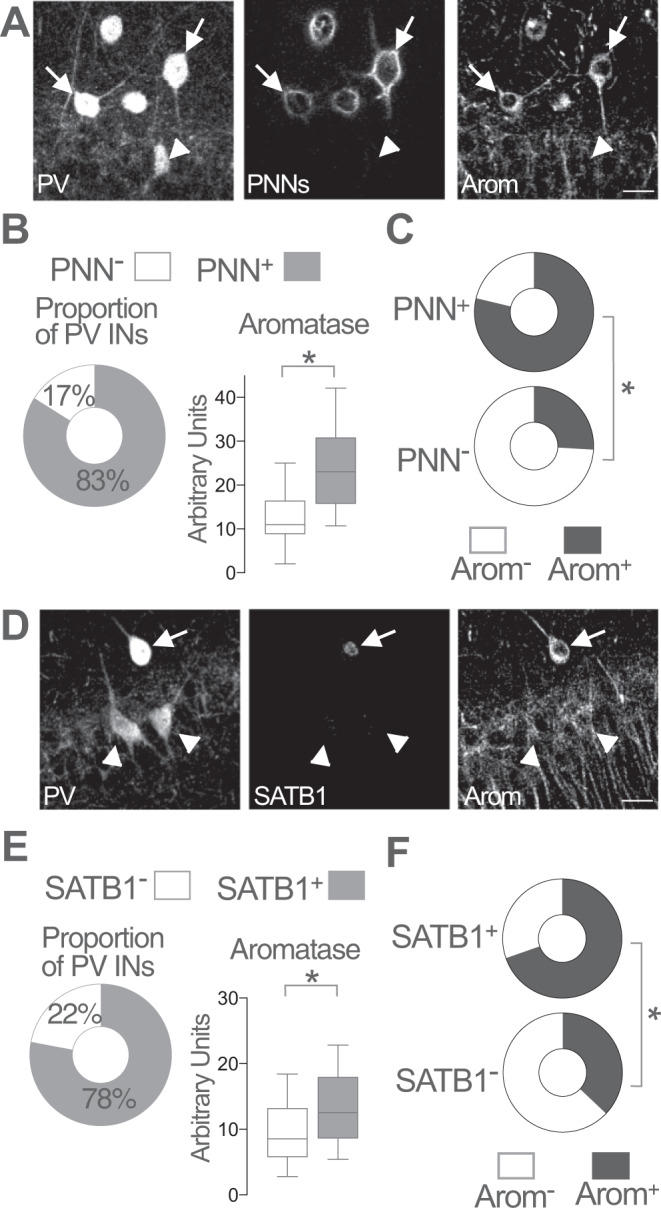
Fig. 2. Aromatase expression in PNNs and SATB1-expressing PV-IN.

A Representative images of parvalbumin (PV), aromatase (Arom) and WFA staining (perineuronal nets, PNNs) in adult female mice CA1 region. WFA staining was used to reveal the presence (arrows) or absence (arrowheads) of PNNs surrounding parvalbumin inhibitory neurons (PV-INs). Scale bar: 20 μm. B Proportion of PV-INs surrounded by PNNs (left plot). Higher aromatase levels were detected in PNN+ PV-INs as compared with PNN− PV-INs (right plot). Unpaired two-tailed t-test, *p < 0.0001, t(168) = 4.3; n = 170 PV-IN from 3 female mice. C Proportion of aromatase expressing (Arom+) neurons was higher in PNN+ PV-INs (upper plot) compared with PNN− PV-INs (lower plot). Two-sided Fisher’s exact test, p < 0.0001; n = 170 PV-IN from 3 female mice. D Representative images of PV, aromatase and SATB1 staining in adult female mice CA1 region. Arrow points to a SATB1+ PV-IN. Arrowheads point to SATB1− PV-INs. Scale bar: 20 μm. E Proportion of PV INs expressing SATB1 (left plot). Higher aromatase levels were detected in SATB1+ PV-INs as compared with SATB1− PV-INs (right plot). Two-tailed Mann–Whitney test, U = 3304, p < 0.0001; n = 245 PV-INs from 3 female mice. F Proportion of aromatase expressing (Arom+) neurons was higher in SATB1+ PV-INs (upper plot) compared with SATB1− PV-INs (lower plot). Two-sided Fisher’s exact test, p < 0.0001; n = 245 PV-IN from 3 female mice. Whisker in plots represent median and 10–90 percentiles. *p < 0.05. Source data are provided as a Source Data file.
