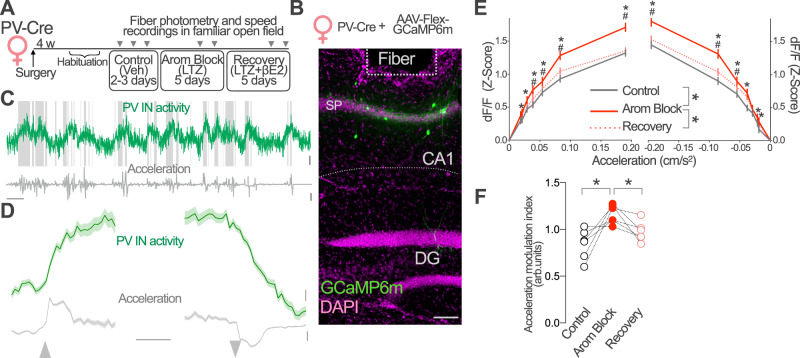
Fig. 6. Aromatase regulates PV-IN activity in vivo.
A Parvalbumin-Cre (PV-Cre) female mice were infected with AAV-Flex-GCaMP6m and an optic fiber was implanted above CA1 area. After habituation to an open field arena (5 days), mice received daily intraperitoneal injections of vehicle (Control, 2–3 days), the aromatase blocker letrozole (LTZ, Arom Block, 5 days) and LTZ+ 17β-estradiol (βE2, Recovery). Fiber photometry signal and speed were registered 90 min after the last injection during each treatment condition as indicated, while animals were freely exploring the open field (10 min). B Representative image of GCaMP6m expression (green) and optic fiber placement above CA1 stratum pyramidale (SP). Scale bar 0.1 mm. C Representative GCaMP6m fluorescence (green) during exploration in control conditions. Shaded areas mark mobility periods. Instantaneous acceleration (gray) was used to analyze locomotory behavior. Scale bars: 10 s, 1% dF/F and 0.1 m/s2. D Event-triggered average traces for immobility to locomotion (left) and locomotion to immobility (right) transitions. Traces show mean ± SEM for all recorded mice (n = 6) during control sessions. Scale bars: PV IN activity, 0.1 Z-score; acceleration 0.02 m/s;2 1 s. E Plots show PV-INs response to acceleration (right) and deceleration (left) in each treatment condition. PV-INs responses increased during Arom Block treatment (red) with respect to control (gray) and recovery (dotted red) conditions. Two-way, repeated measures ANOVA, treatment F(2, 238820) = 246.8, p < 0.0001. Bonferroni’s comparison tests, *p < 0,05 Control vs. Arom Block, #p < 0,05 Recovery vs. Arom Block. n corresponds to instant measurements, data obtained from 6 female mice. Data represent mean ±95% confidence interval. F The acceleration modulation of PV-INs increased after aromatase pharmacological blockade (Arom Block) and returned to control levels when animals receive βE2 to compensate for lack of endogenous estradiol synthesis (Recovery). One-way ANOVA, F(2, 15) = 9.94, p = 0.002; Bonferroni’s comparison tests Control vs. Arom Block p = 0.001, Arom Block vs. Recovery p = 0.038; n = 6 mice. Data represents values for individual mice. *p < 0.05. Source data are provided as a Source Data file.

