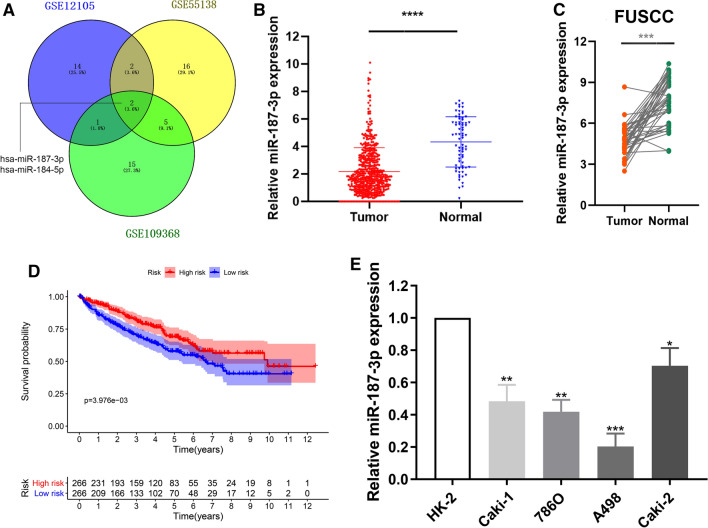
Fig. 1.
Screening and identification of miR-187-3p for ccRCC from multiply datasets. A The overlap among the three datasets in Venn diagram. B Relative miR-187-3p expression level in ccRCC and normal tissues base on TCGA cohort. C Relative miR-187-3p expression level in ccRCC and normal tissues based on FUSCC cohorts. D Survival plots of miR-187-3p expression for ccRCC patients. E The relative miRNA expressions of miR-187-3p in four ccRCC cell lines and a normal cell line HK-2. *P < 0.05; **P < 0.01; ***P < 0.001; ****P < 0.0001

