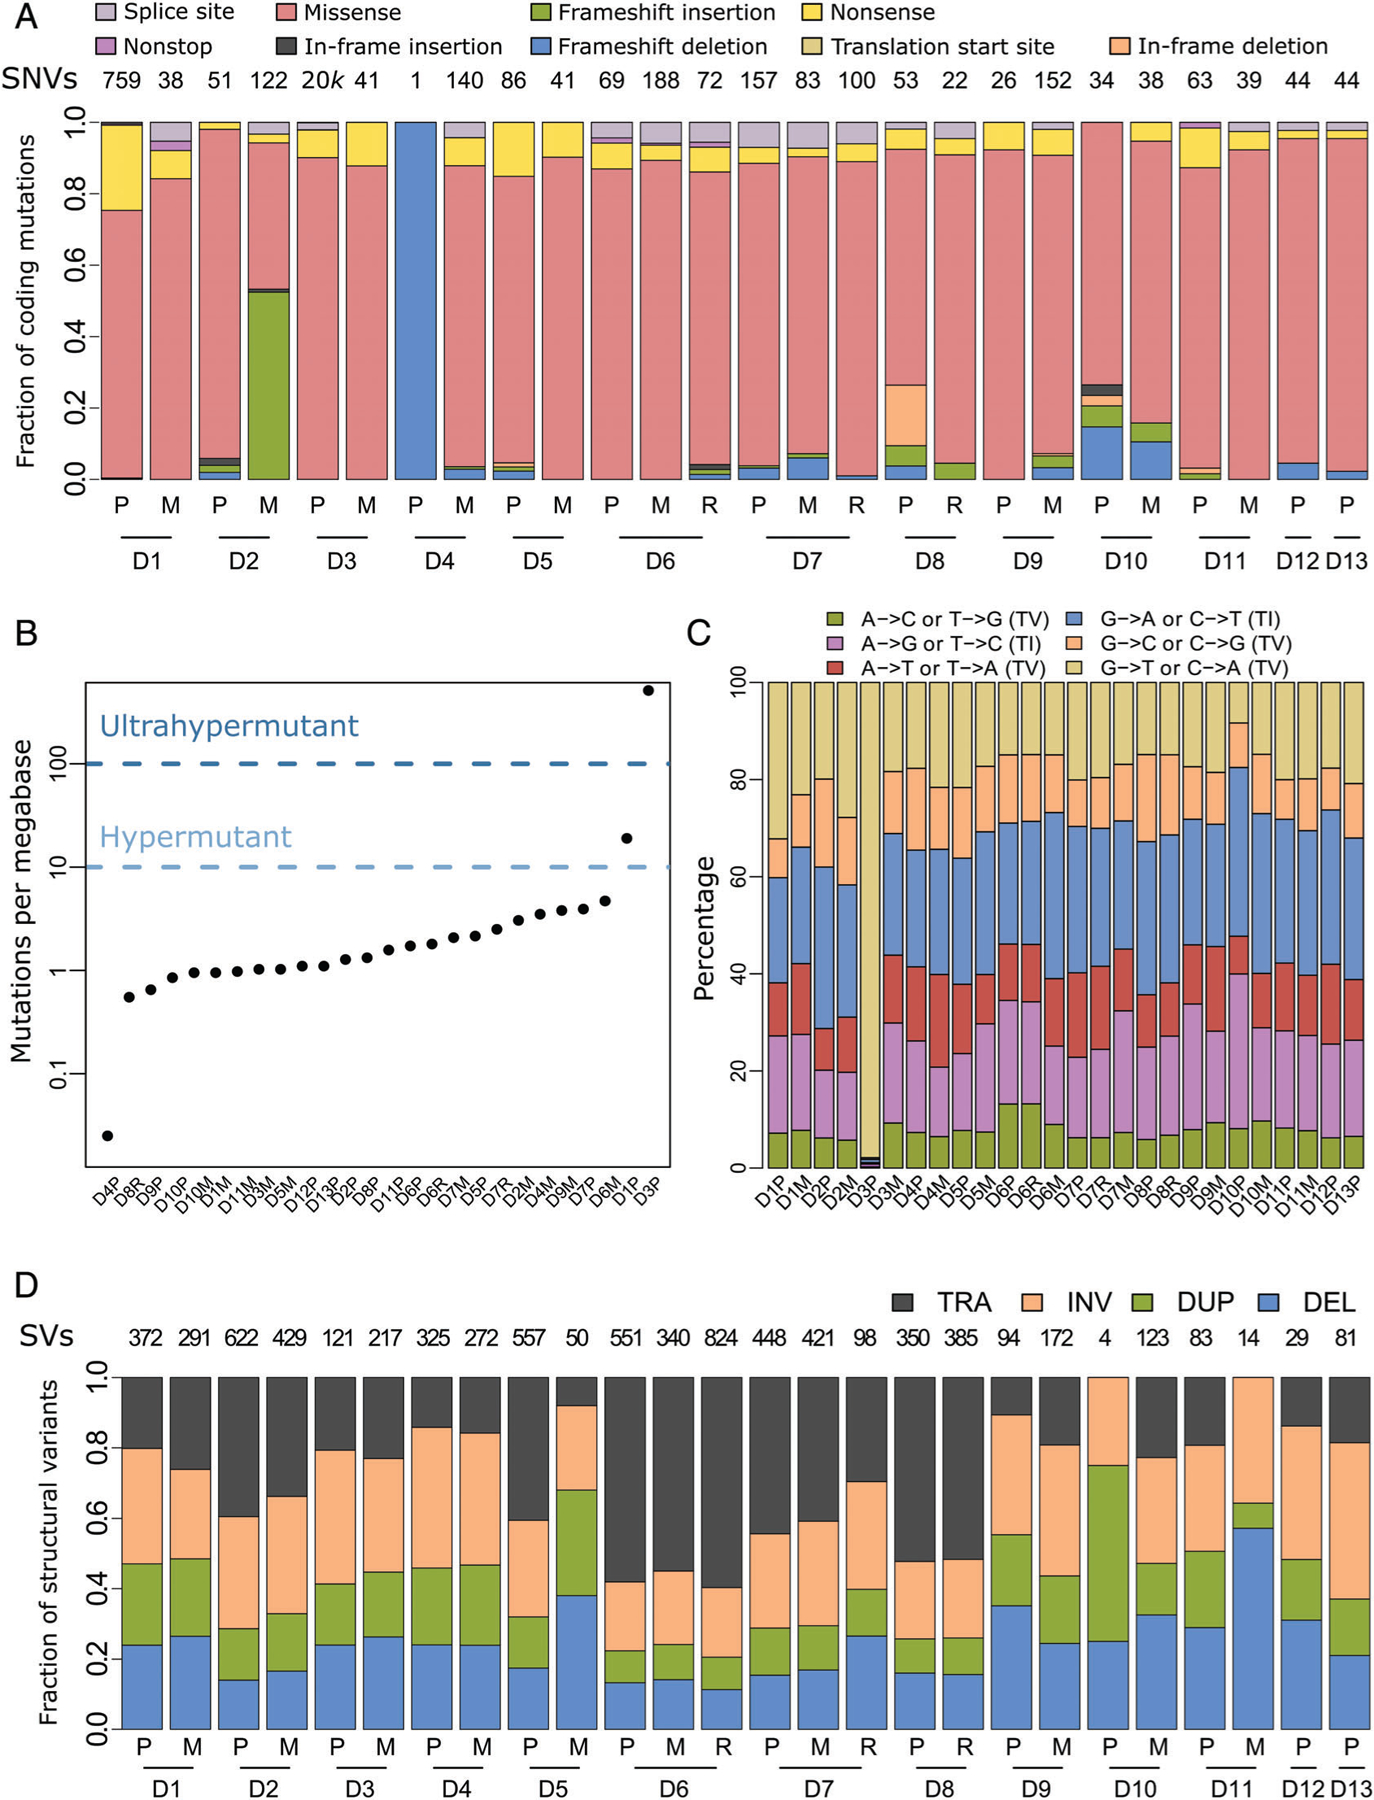
Figure 1.

Somatic mutations in the pediatric osteosarcoma cohort. (A) Fractions of the indicated color-designated coding SNVs identified in primary (P), local recurrence (R) and metastatic (M) samples grouped by patient numbers (D1 –13). Total SNVs per patient are indicated above each column. (B) Number of somatic mutations per megabase (Mb) identified in coding regions of each of the 26 tumor samples. One tumor was classified as hypermutant (>10 Mb) and one as ultrahypermutant (>100 Mb), while the remainder were classified as nonhypermutated (<10 Mb). (C) Transition (TI)/transversion (TV) graph showing the percentage of each type of the six possible base pair substitutions. For the hypermutated tumor, D3P, C to A transversions contributed to the vast majority (>90%) of substitutions. (D) Fractions of structural variant (SV) types, translocations (TRA), inversions (INV), duplications (DUP) and deletions (DEL) across the tumor cohort. Total numbers of SVs per patient are reported along the top. Matching tumors are grouped by the indicated patient numbers.
