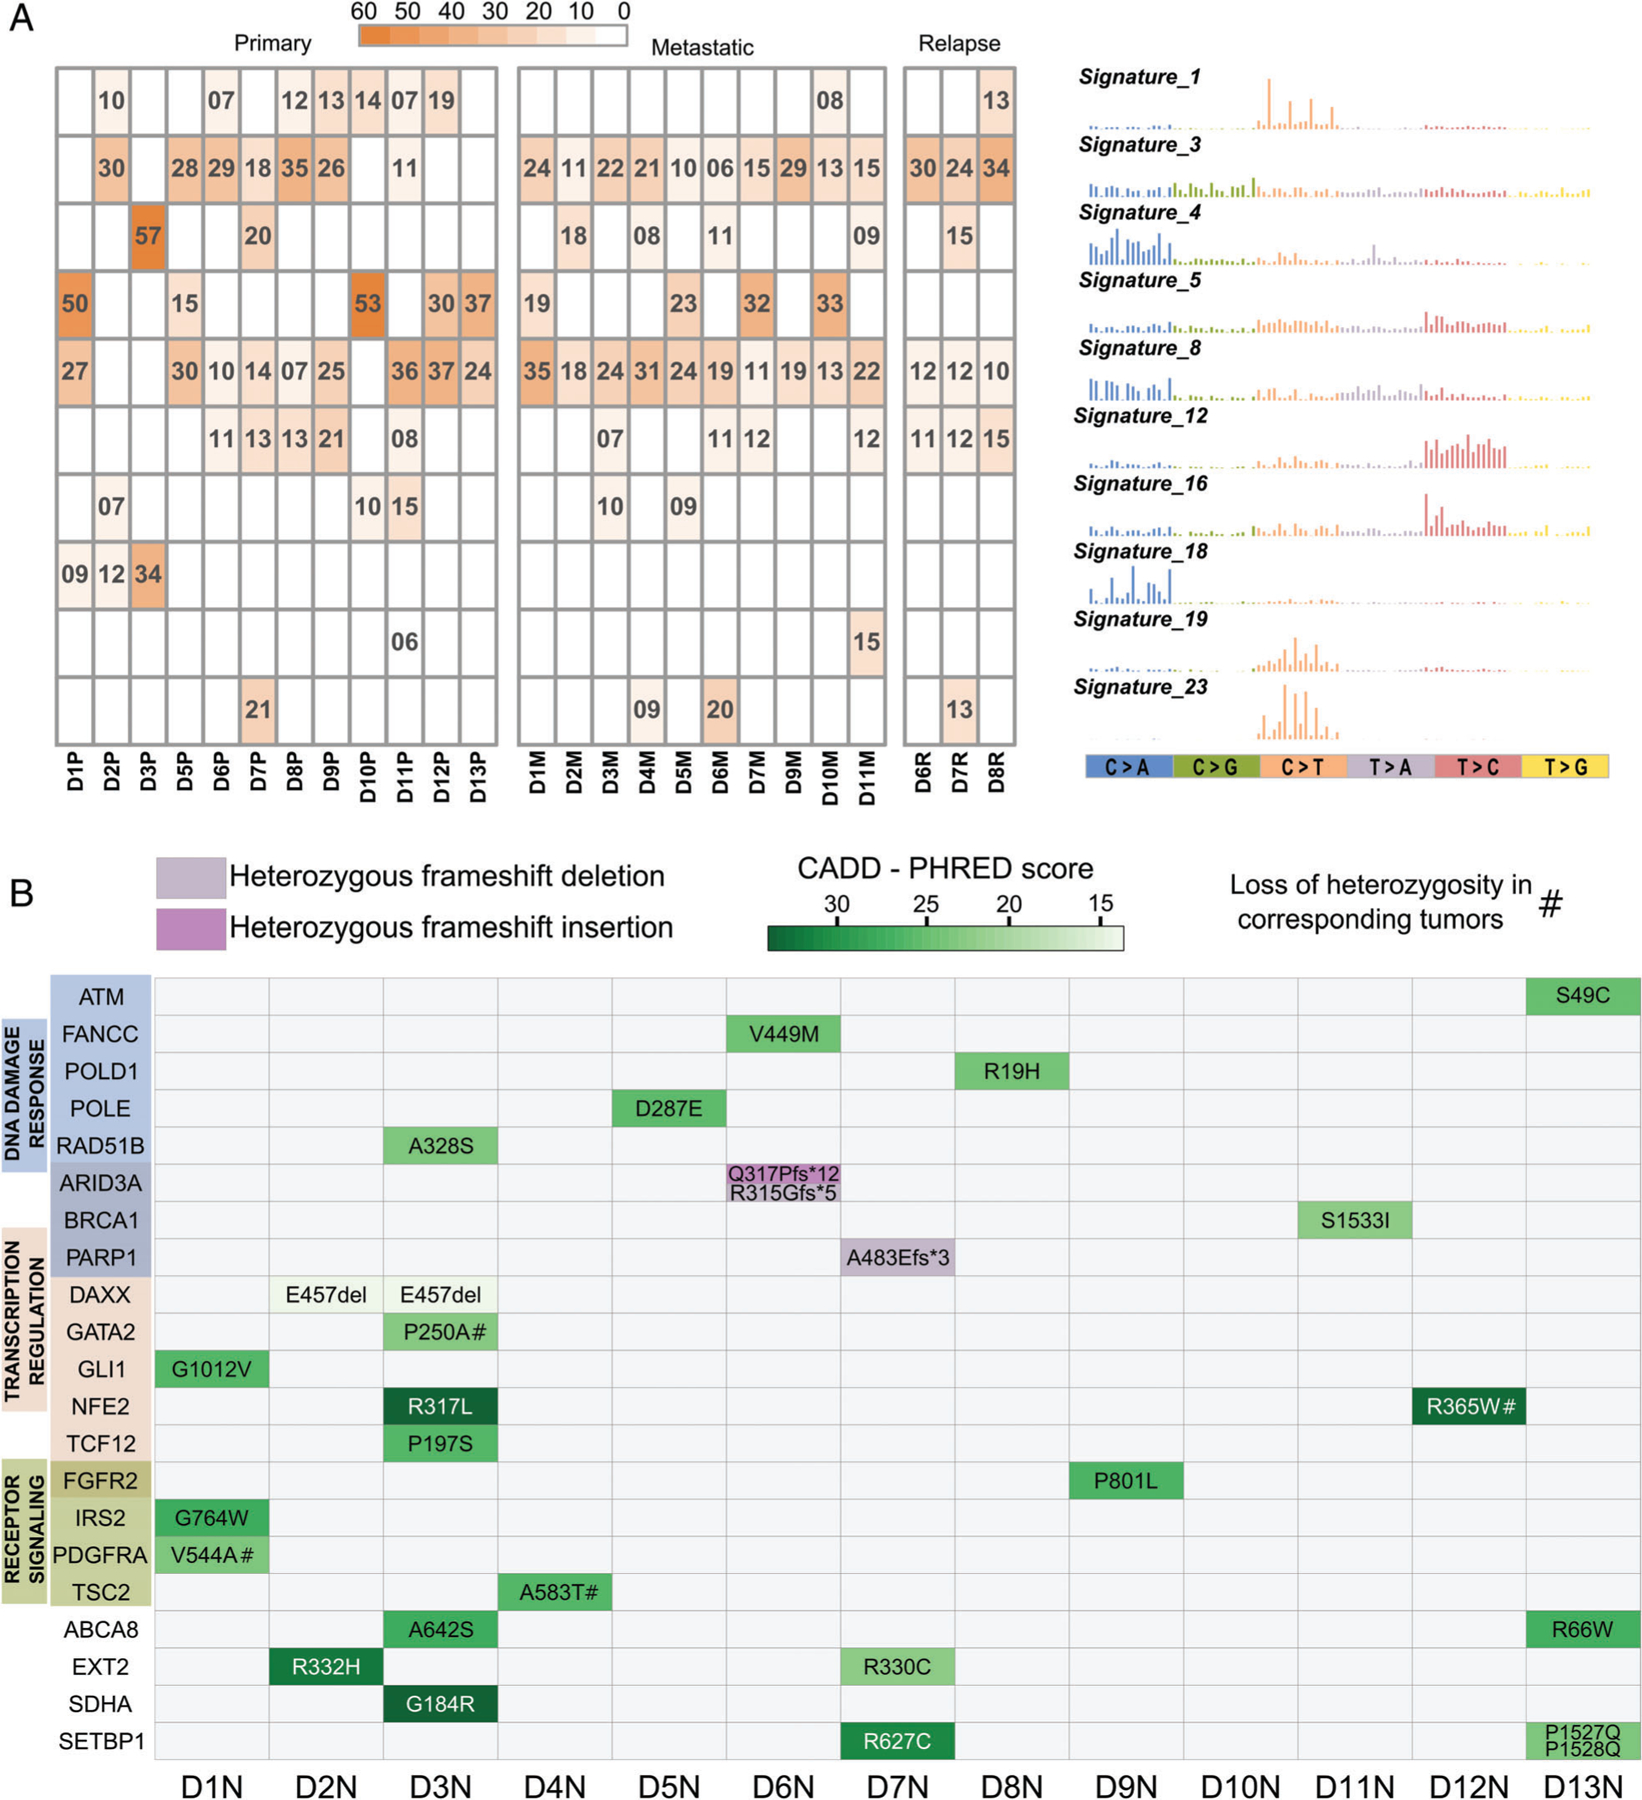
Figure 2.

Mutational signatures and germline variants. (A) Heatmap showing percentages of the mutational profiles of each tumor that can be explained by the corresponding COSMIC signature shown on the right. Only signatures contributing to ≥15% of any individual tumor profile are included. (B) Germline mutations identified in the 13 normal samples (D1N–D13N) and predicted to be potentially deleterious by Polymorphism Phenotyping (PolyPhen) or by sorting intolerant from tolerant (SIFT) and with CADD–PHRED score > 10, in 21 genes previously associated with cancer as part of the OncoKB database. Green scale intensity corresponds to CADD-PHRED score. A score greater than 20 indicates that the substitution is predicted to be more deleterious than 99% of all possible substitutions of the human genome and a score greater than 30 more deleterious than 99.9%. Frameshift mutations (insertion or deletion) are color-coded as indicated. Genes are grouped based on gene ontology categories; gene names colored in a darker shade belong to both adjacent categories.
