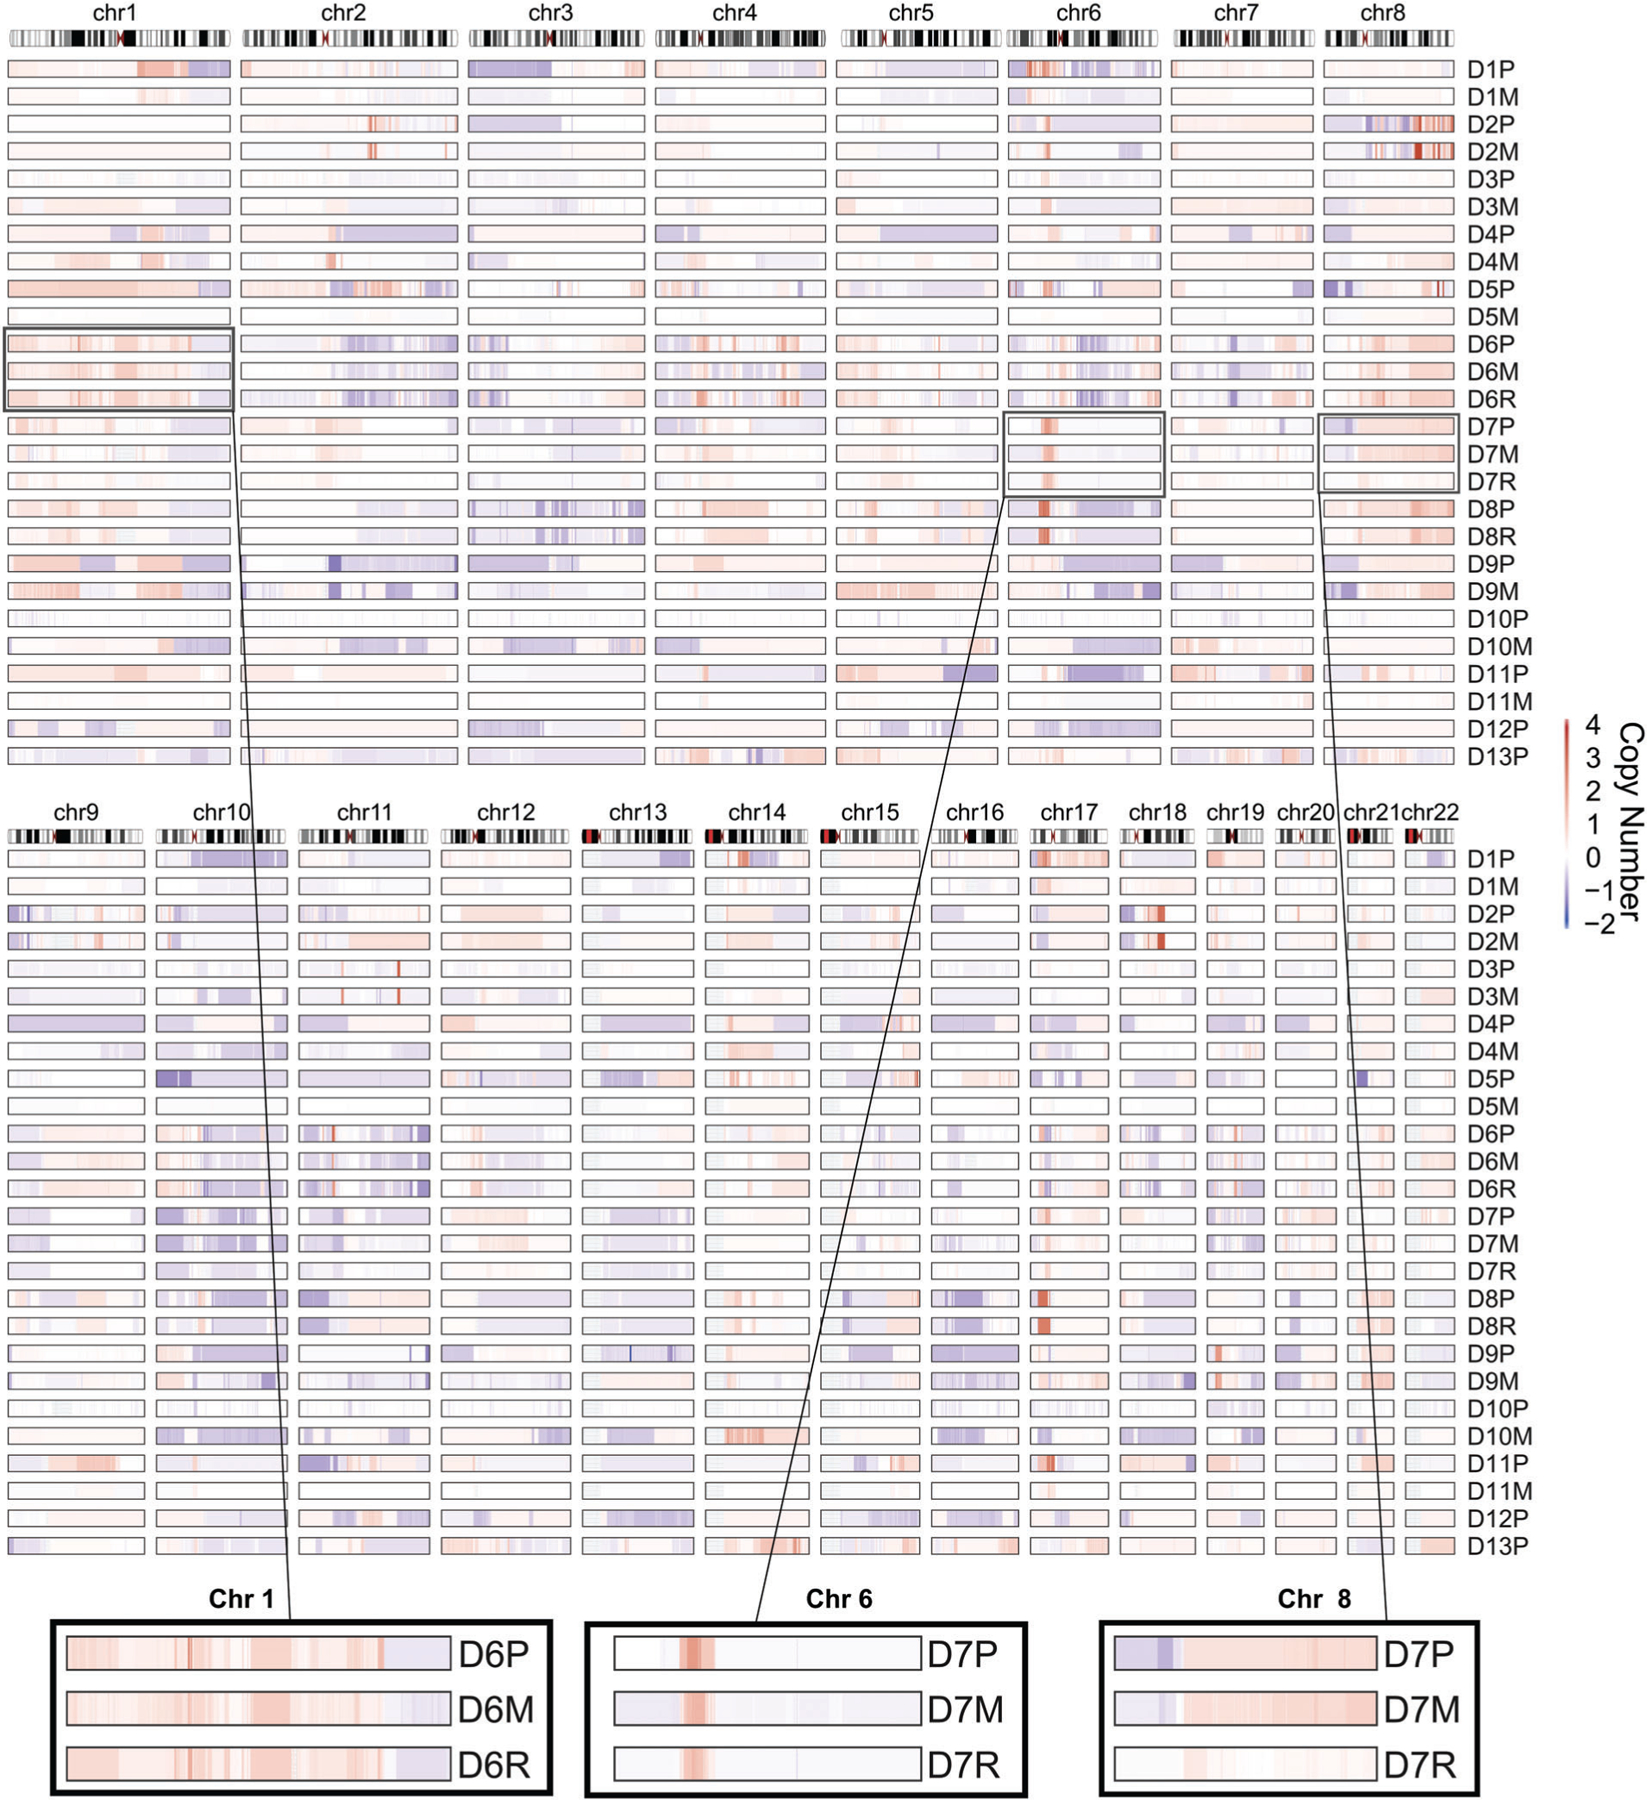
Figure 3.

Copy number alterations in pediatric osteosarcoma. Copy number profiles as computed by TITAN for each tumor in the cohort, showing gains (red) and losses (blue) as indicated in the heat map on the right. Relative genomic locations are represented on the top. Zoomed in areas highlight examples of regions with high (left and center panels) and low degrees of conservation (right panel) across the indicated primary (P)/local recurrence (R)/metastatic (M) tumor trio.
