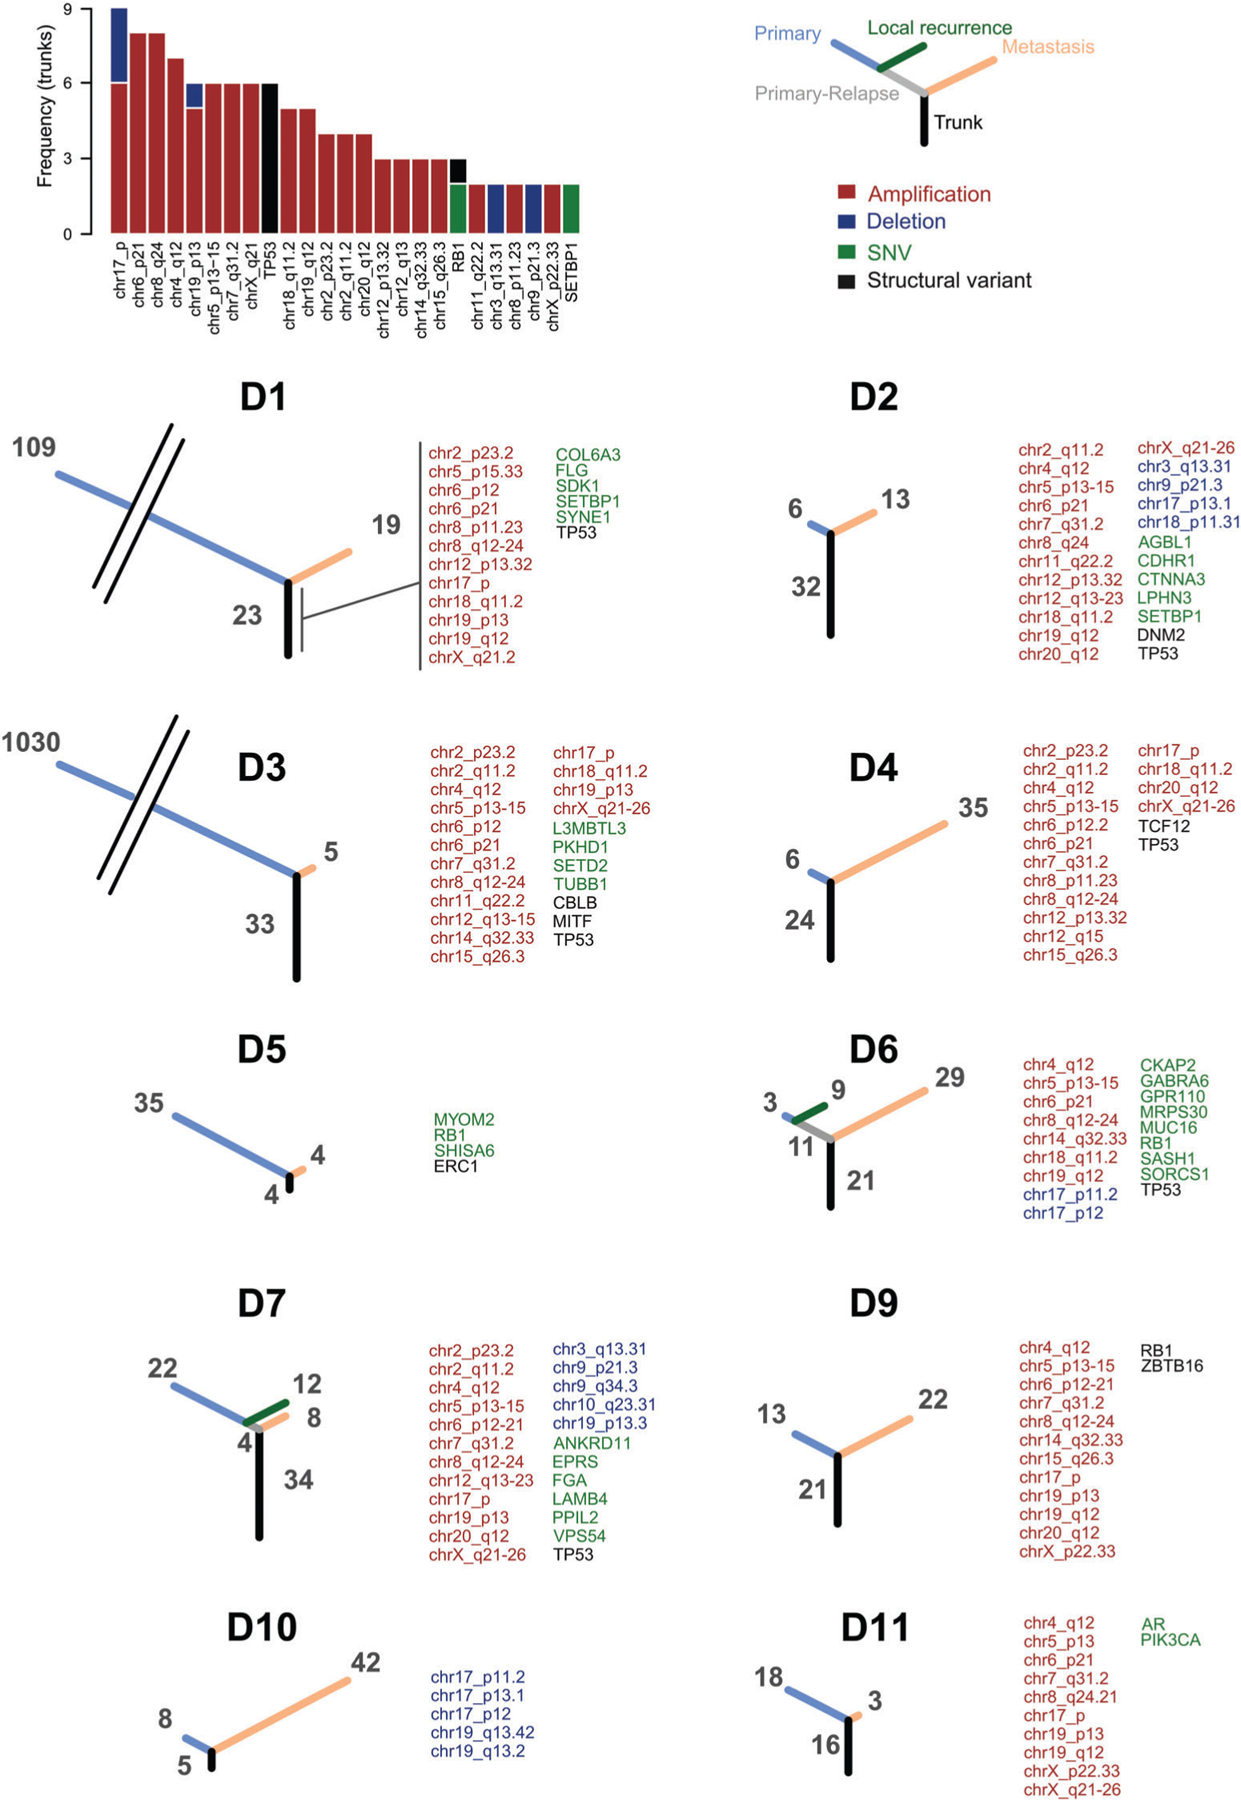
Figure 4.

Phylogenetic trees of primary, local relapses and metastatic tumors. The barplot shows the frequency of genes and chromosomal locations recurrently altered in the primary tumors and retained by matching metastasis. The phylogenetic trees show the number of alterations common to primary and metastatic tumors (black), common to primary and local relapse (gray), private to the primary (blue), to the local relapse (green) or to the metastasis (orange). Tree branches are proportional to the number of alterations. Trunk alterations are reported for each matching pair. Adjacent cytoband names are merged into ranges for improved readability.
