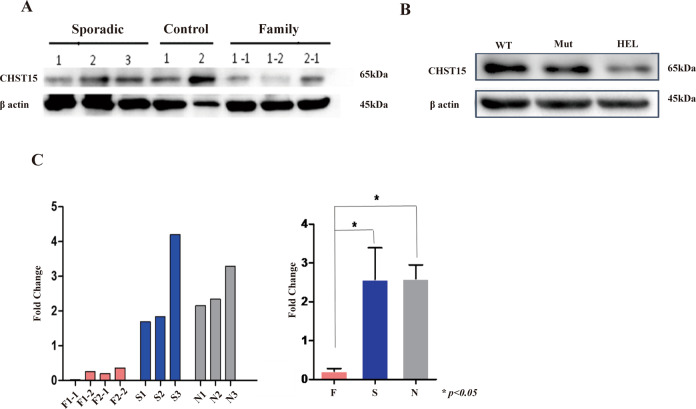
Fig. 4. CHST15 protein and mRNA expression in familial MPN patients and HEL cells with CHST15 mutant (Western blot results).
A from left to right, CHST15 blotting bands represent sporadic MPN patients; healthy controls and familial MPN, respectively. B CHST15 protein expression on HEL cells with wild-type CHST15 (WT) and mutant CHST15 gene(Mut) and non - transfected HEL cells (HEL). C Quantitative RT-PCR analysis of CHST15 mRNA. Left panel: from left to right, F1-1, F1-2, F2-1, F2-2 indicate familial PMF; S1, S2, S3 indicate sporadic PMF; N1, N2, N3 indicate normal individuals. Results are means of three independent experiments. Right panel: when the mRNA expression levels were compared by pairwise comparison, the results showed that there was significantly depressed expression on CHST15 mRNA in familial MPN (p < 0.05).

