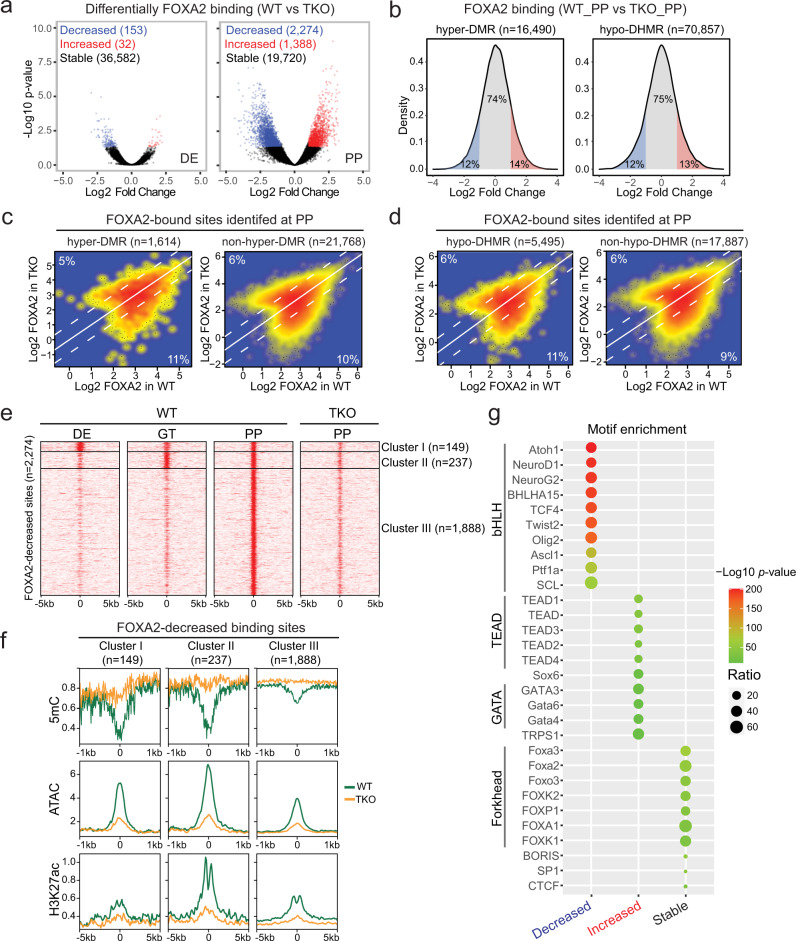
Fig. 4. De novo binding of FOXA2 at differentiation stage-specific genomic loci enriched for bHLH motifs.
a Volcano plots of FOXA2 ChIP-seq reads illustrating differential FOXA2 binding sites identified in TKO cells compared to WT cells at the DE (left) and PP stage (right). Red and blue represent increased and decreased FOXA2 signals in TKO cells, respectively (|fold change| ≥ 2; FDR < 0.05). b Density plots showing the percentages of differential FOXA2 binding in TKO_PP compared to WT_PP at hyper-DMRs (left) and hypo-DHMRs (right). The colors red, blue, and gray represents increased, decreased, and non-changed FOXA2 signals in TKO_PP cells, respectively (|fold change| ≥ 2). c Scatterplots presenting FOXA2 signals in WT_PP versus TKO_PP at FOXA2 binding sites overlapped with (left) or without (right) hyper-DMRs. Percentages of differential FOXA2 binding are indicated (|fold change| ≥ 2). d Scatterplots presenting FOXA2 signals in WT_PP versus TKO_PP at FOXA2 binding sites overlapped with (left) or without (right) hypo-DHMRs. Percentages of differential FOXA2 binding are indicated (|fold change| ≥ 2). e Clustering of FOXA2 binding signals at the DE, GT, and PP stage in regions showed lost FOXA2 in TKO_PP cells. f Average density plot of methylation ratio (5mC/C), ATAC-seq, and H3K27ac ChIP-seq reads at cluster III FOXA2-decreased regions in PP for WT (green) and TKO (orange) cells. g Transcription factor motif enrichment analysis of genomic regions showed decreased, increased, and stable FOXA2 binding in TKO_PP cells. The significance was statistically determined by ZOOPS scoring coupled with hypergeometric enrichment calculations without multiple test correction. The top 10 known motifs are shown. The color represents p-values and the size of circle represents the proportion of peaks containing a TF motif for each group.

