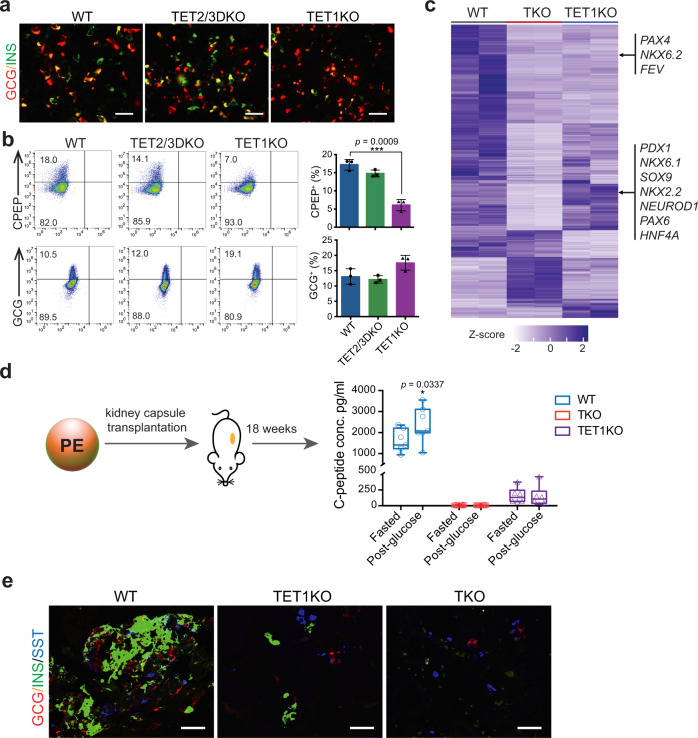
Fig. 5. TET1-knockout cells show impaired differentiation into functional β-cells.
a Immunostaining of INS, and GCG in WT, TET2/3DKO, and TET1KO cells at the PE stage (n = 3 independent differentiation; scale bar = 50 μm). b Representative plots of flow cytometry of human C-peptide (CPEP) and glucagon (GCG) in WT, TET2/3DKO, and TET1KO cells at the PE stage. Quantifications of the percentage of CPEP+ or GCG+ cells are shown in the right panel. (n = 3 independent differentiations; student’s t-test, 2-sided; without multiple test correction). All bar graphs show mean ± SD. c Heatmap showing the hierarchical clustering of DEGs among WT, TKO, and TET1KO cells at the PP stage. Each row represents one DEG, and each column represents one biological replicate. The color scale from white to blue represents normalized gene expression levels from low to high (|fold change| ≥ 2; FDR < 0.05). d WT (n = 7), TKO (n = 12), and TET1KO (n = 6) cells were differentiated to the PE stage and transplanted under the kidney capsule of nondiabetic female SCID-beige mice. Eighteen weeks post-implantation, human C-peptide levels were measured after an overnight fast and 30 min following an i.p. glucose injection. C-peptide levels from individual mice are shown in box and whisker plots (Plots are centered on mean, with box encompassing 25th-75th percentile and whiskers representing minimum to maximum range; student’s t-test, 1-sided; without multiple test correction). e Immunostaining of insulin (INS), glucagon (GCG), and somatostatin (SST) in cell grafts from WT_PE, TET1KO_PE, and TKO_PE transplanted mice (n = 2 independent experiments; scale bar = 50 µm).

