
Fig. 2. Control of gene expression through induction of plasmid copy number.
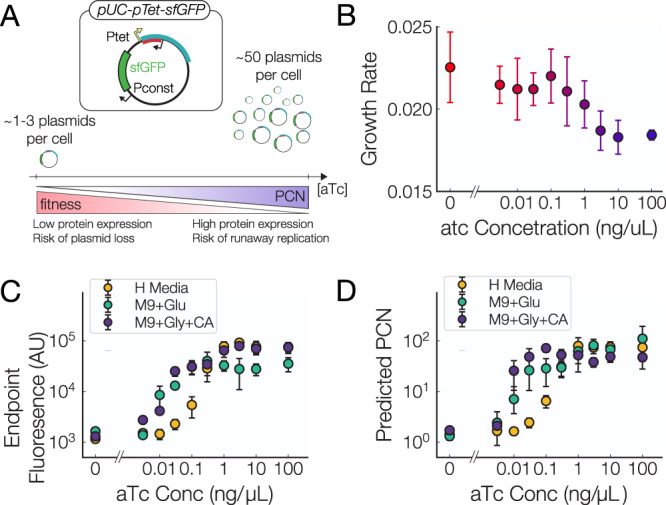
A Schematic of the effects of adding aTc to the pUC-pTet-sfGFP plasmid. As the concentration is increased the number of plasmids and sfGFP genes increases as well as the metabolic cost of the plasmid. B Growth rates of cells hosting the pUC-pTet-sfGFP plasmid as a function of aTc concentration. C sfGFP Production of the pUC-pTet-sfGFP plasmid grown at different aTc concentrations. D Estimated plasmid copy numbers from sfGFP measurements of our plasmids. We see that the copy number induction curve shifts towards lower aTc concentration as with decreasing media richness. For all panels, Data points are means over biological replicates, error bars = std. dev. (n = 6).