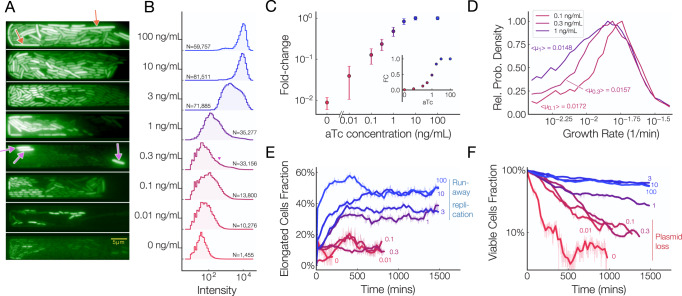
Fig. 3. Microscopic Analysis of sfGFP Expressed by the pUC-pTet.
A Representative snapshots of microfluidic chambers at various aTc concentrations. Slow-growing cells at high copy number are indicated by orange arrows and cells at 0.3 ng/mL of aTc in an “activated” state are indicated by purple arrows. Experiments in 100 ng/mL and 0.1 ng/mL conditions were repeated twice with similar results, all other experiments were repeated once. B Distribution of cellular fluorescence intensities at increasing aTc concentrations. C Normalized mean fluorescence as a function aTc concentration, log scale. Inset: Normalized mean fluorescence vs aTc concentration on a linear scale. N = number of cells listed in corresponding condition in Panel B. Data points are averages over all cells, error bars = std. dev. of distributions in panel B. D Growth rate distributions of cells grown at 0.1, 0.3, and 1 ng/mL aTc. E Fraction of slow-growing, elongated cells over time at several aTc concentrations. This measurement is indicative of the extent to which cells are burdened by the high plasmid copy numbers. F Proportion of viable cells as a function of time at various aTc concentrations. The sharp decrease in the number of viable cells at low aTc concentrations provides insight into the extent to which plasmid loss occurs at low copy numbers.

